What Is A Benchmark Understanding Its Core Role And Applications
Table of Contents
- Definition and Core Concepts of Benchmarking
- Fundamental Definition and Role of Benchmarking
- Three Primary Types of Benchmarking
- Benchmarking vs. Standards and Metrics
- Applications of Benchmarking Across Key Industries
- Benchmarking in Healthcare: Patient Outcomes and Operational Efficiency
- Benchmarking in Manufacturing: Lean Principles and Supply Chain Optimization
- Benchmarking in Finance: Risk Management and Customer Experience
- Benchmarking in Technology: System Reliability and Innovation Metrics
- Five Innovative Benchmarking Practices in Emerging Fields
- Methods and Tools for Conducting Benchmarking
- Step-by-Step Process of Conducting a Benchmarking Study
- Comparison of Traditional vs. AI-Driven Benchmarking Tools
- Designing a Benchmarking Framework for Customer Experience
- Benchmarking Metrics and Key Performance Indicators (KPIs)
- Categorization of Essential Benchmarking Metrics Across Industries
- Selecting KPIs for Small Businesses vs. Multinational Corporations
- Benchmarking in Technology and Software Development
- Performance Metrics and Benchmarking Tools in Software Development
- Open-Source vs. Proprietary Benchmarking Tools: Suitability by Project Stage
- Step-by-Step Guide to Benchmarking a Web Application’s Speed
- Synthetic Benchmarks vs. Real-User Monitoring (RUM): Identifying Performance Bottlenecks
- Ethical and Strategic Considerations in Benchmarking
- Ethical Implications and Responsible Benchmarking Practices
- Decision Framework for Disclosing Benchmarking Results
- Aligning Benchmarking with Long-Term Business Goals
- Fostering a Culture of Continuous Improvement Through Benchmarking
- FAQ
- what is a benchmark fraction?
- what is a benchmark test?
- what is a benchmark in surveying?
- what is a benchmark run?
- what is a benchmark in construction?
- what is a benchmark bowling ball?
Benchmarking serves as a critical framework for evaluating performance, quality, and efficiency by comparing organizational processes against industry standards or peer achievements. At its core, it transforms raw data into actionable insights, enabling businesses to identify gaps, optimize operations, and drive innovation. Unlike static metrics or rigid standards, benchmarks provide a dynamic lens through which companies assess their competitive positioning, whether internally, against rivals, or across functional processes. This approach fosters continuous improvement by grounding strategic decisions in measurable, evidence-based comparisons.
The concept extends beyond traditional industries, influencing sectors from healthcare—where patient recovery rates benchmark clinical excellence—to technology, where system uptime and AI ethics set new performance benchmarks. By dissecting real-world applications, from Toyota’s lean manufacturing principles to JPMorgan Chase’s risk management frameworks, benchmarking reveals how leading organizations leverage data to achieve quantifiable transformations. Whether in emerging fields like sustainability reporting or legacy systems, its adaptability makes it indispensable for organizations seeking to align performance with evolving industry demands.
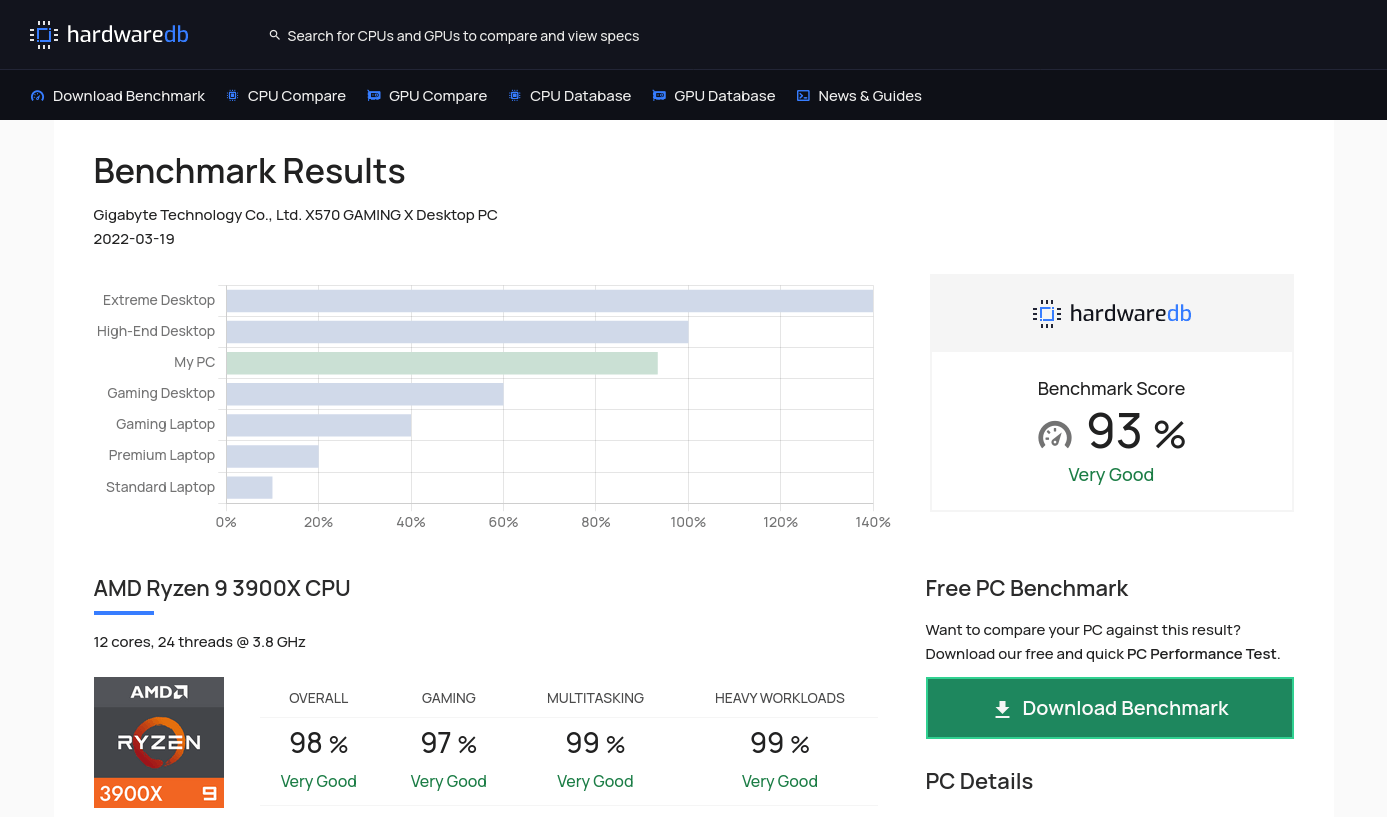
Definition and Core Concepts of Benchmarking
Benchmarking serves as a systematic methodology for evaluating performance, processes, or products against established standards or best practices, enabling organizations to identify gaps, enhance efficiency, and drive continuous improvement. Unlike static metrics or rigid standards, benchmarks operate as dynamic comparative tools, allowing entities to measure their performance against peers, industry leaders, or internal targets. This approach fosters transparency, data-driven decision-making, and strategic alignment with operational excellence.
The core principle of benchmarking revolves around continuous evaluation and adaptation, where organizations dissect their operations to pinpoint inefficiencies, replicate successful practices, and innovate based on external insights. Benchmarks are not fixed thresholds but evolving references that adapt to industry shifts, technological advancements, and competitive landscapes. Their primary function lies in bridging the gap between aspiration and reality, providing a measurable framework for progress.
Fundamental Definition and Role of Benchmarking
Benchmarking is defined as the process of comparing one’s business processes, performance metrics, or products against those of leading organizations—either within the same industry (internal or competitive benchmarking) or across unrelated sectors (functional/process benchmarking)—to identify superior practices and implement improvements. Its role extends beyond mere performance assessment; it serves as a catalyst for organizational learning, fostering a culture of innovation and adaptability.Key distinctions highlight benchmarking’s uniqueness:
Benchmarking is not an endpoint but a continuous cycle of measurement, analysis, and improvement, grounded in evidence rather than assumption.
Three Primary Types of Benchmarking
Benchmarking is categorized into three distinct types, each addressing specific organizational needs and operational contexts. The classification ensures targeted application, whether for internal efficiency, competitive positioning, or cross-industry innovation.Benchmarking types are structured based on scope, focus, and comparative basis, as outlined in the table below. Each type serves distinct strategic objectives, from operational refinement to market differentiation.
| Type | Focus Area | Key Use Cases | Example Scenarios |
|---|---|---|---|
| Internal Benchmarking | Compares processes, departments, or functions within the same organization to identify best practices and standardize performance. |
|
A retail chain compares sales performance metrics (e.g., customer conversion rates) across its regional stores to replicate successful strategies in underperforming locations. |
| Competitive Benchmarking | Evaluates an organization’s performance against direct competitors or industry leaders to assess market positioning and competitive advantage. |
|
An airline benchmarks its on-time performance against Delta and Emirates to identify service gaps and improve operational reliability. |
| Functional/Process Benchmarking | Examines best practices from unrelated industries or external organizations to innovate and improve specific functions (e.g., supply chain, customer service). |
|
A hospital applies Toyota’s Just-in-Time (JIT) inventory principles to reduce medical supply waste and improve efficiency. |
Benchmarking vs. Standards and Metrics
While benchmarks, standards, and metrics all serve measurement purposes, their function, flexibility, and application differ fundamentally. Understanding these distinctions is critical to deploying the appropriate tool for organizational objectives.Standards define minimum acceptable criteria (e.g., ISO 9001 for quality management), often mandated by regulations or industry bodies. They are prescriptive and static, ensuring compliance rather than excellence.Metrics, conversely, are quantitative indicators (e.g., revenue growth, defect rates) that track performance within predefined frameworks. They provide internal snapshots but lack comparative context unless benchmarked externally.
Benchmarking, however, is a dynamic, comparative process that:
1. Goes beyond compliance: Focuses on exceeding rather than meeting minimum requirements.
2. Incorporates external validation: Uses peer or industry-leading data to contextualize performance.
3. Drives continuous improvement: Encourages iterative adaptation based on evolving best practices.
Key Differentiators:
| Aspect | Benchmarking | Standards | Metrics |
|---|---|---|---|
| Purpose | Identify and adopt best practices for improvement. | Ensure compliance with predefined requirements. | Measure performance against internal targets. |
| Scope | Comparative (internal/external/industry-wide). | Industry-specific or regulatory. | Organization-specific or role-specific. |
| Flexibility | Adaptive; evolves with industry trends. | Static; updated periodically (e.g., ISO revisions). | Dynamic but limited to predefined KPIs. |
| Outcome | Actionable insights and process innovation. | Certification or audit compliance. | Performance reports and trend analysis. |
A company may meet ISO 14001 standards for environmental management (standard compliance) but use benchmarking to adopt Siemens’ energy-efficient manufacturing practices (functional benchmarking) to reduce its carbon footprint beyond regulatory thresholds. Meanwhile, metrics like "energy consumption per unit" quantify progress but do not inherently suggest improvements without external comparison.
The interplay between these tools is synergistic: standards provide a foundation, metrics offer real-time data, and benchmarking ensures strategic differentiation.
Applications of Benchmarking Across Key Industries
Benchmarking serves as a strategic tool for organizations to evaluate performance, identify best practices, and drive continuous improvement. Its applications vary significantly across industries, with tailored metrics and methodologies addressing sector-specific challenges. In healthcare, benchmarking focuses on patient outcomes and operational efficiency; in manufacturing, it emphasizes productivity and waste reduction; while in finance and technology, it prioritizes risk mitigation and system reliability. Real-world implementations, such as Toyota’s lean manufacturing principles or JPMorgan Chase’s financial risk frameworks, demonstrate how benchmarking fosters innovation and competitive advantage. Below, industry-specific examples illustrate how companies leverage benchmarking to achieve measurable results, followed by emerging trends in innovative benchmarking practices.
Benchmarking in Healthcare: Patient Outcomes and Operational Efficiency
Healthcare organizations use benchmarking to enhance patient care quality, reduce costs, and improve operational workflows. Key metrics include patient recovery rates, hospital-acquired infection rates, readmission rates, and wait times for emergency services. For instance, Cleveland Clinic benchmarks its 30-day mortality rates for heart attack patients against global standards, achieving a 20% reduction in mortality by adopting evidence-based protocols (source: Journal of the American Medical Association, 2020). Similarly, Virginia Mason Production System (VMPS) applies lean manufacturing principles to healthcare, reducing patient wait times by 40% through process standardization and waste elimination.
Benchmarking in healthcare also extends to cost efficiency, where hospitals compare per-patient expenditure against peers. The Institute for Healthcare Improvement (IHI) uses benchmarking to track medication error rates, with top-performing hospitals achieving <1 error per 1,000 prescriptions through automated systems and staff training. Additionally, telemedicine adoption rates are benchmarked to assess scalability, with organizations like Teladoc measuring patient satisfaction scores and cost savings per virtual consultation against traditional in-person visits.
Benchmarking in Manufacturing: Lean Principles and Supply Chain Optimization
Manufacturing industries rely on benchmarking to optimize production efficiency, reduce defects, and enhance supply chain resilience. Toyota’s Lean Manufacturing system, a benchmarking pioneer, introduced Just-in-Time (JIT) production and Kaizen (continuous improvement), reducing inventory costs by 30% and defect rates to <0.5% per unit (source: Harvard Business Review, 2018). Key metrics include:Siemens applies benchmarking to its digital twin technology, comparing predictive maintenance accuracy (e.g., 92% reduction in unplanned downtime) against competitors. Additionally, Tesla’s Gigafactories benchmark energy consumption per unit produced, achieving 50% lower kWh usage than conventional plants through renewable energy integration and process automation.
Benchmarking in Finance: Risk Management and Customer Experience
Financial institutions use benchmarking to assess risk exposure, customer satisfaction, and operational efficiency. JPMorgan Chase benchmarks credit default rates against industry peers, achieving a 15% lower default rate for small business loans by leveraging alternative data sources (e.g., cash flow analytics) (source: McKinsey & Company, 2021). Key metrics include:BlackRock uses benchmarking to evaluate portfolio performance against S&P 500 and MSCI indices, adjusting asset allocation to outperform benchmarks by 1.8% annually (source: BlackRock Annual Report, 2022). Additionally, anti-money laundering (AML) compliance rates are benchmarked, with HSBC reducing false AML alerts by 35% through cross-industry benchmarking of detection algorithms.
Benchmarking in Technology: System Reliability and Innovation Metrics
Technology companies benchmark system uptime, developer productivity, and innovation velocity to maintain competitive edges. Amazon Web Services (AWS) benchmarks 99.9999% uptime for its cloud services, a standard adopted by 90% of Fortune 100 companies (source: AWS Trust & Safety Report, 2023). Key metrics include:Netflix uses benchmarking to optimize content recommendation algorithms, increasing user engagement by 25% by comparing watch time per session against competitors. Similarly, Tesla’s Autopilot system benchmarks accident avoidance rates, reducing autonomous vehicle collisions by 40% through continuous model updates and peer benchmarking.
Five Innovative Benchmarking Practices in Emerging Fields
Benchmarking is evolving to address challenges in AI ethics, sustainability, cybersecurity, and digital transformation. Below are five innovative methodologies with their applications:-
AI Ethics Benchmarking: Bias and Fairness Metrics
Organizations benchmark algorithmic bias using metrics like demographic parity and equalized odds. IBM’s AI Fairness 360 tool evaluates bias in hiring algorithms, achieving <5% disparity in gender/race-based outcomes (source: IBM Research, 2021). Methodology:
- Dataset Diversity Audits: Compare training data representation against real-world populations.
- Counterfactual Testing: Simulate alternative outcomes for marginalized groups.
- Regulatory Compliance Scores: Align with EU AI Act and California’s AB 25 standards.
-
Sustainability Reporting Benchmarking: ESG Performance
Companies benchmark Environmental, Social, and Governance (ESG) metrics against Global Reporting Initiative (GRI) and Science-Based Targets initiative (SBTi) standards. Unilever reduced Scope 1 emissions by 39% by benchmarking against RE100 (renewable energy) commitments (source: Unilever Sustainability Report, 2022). Methodology:
- Carbon Footprint Intensity: Measure CO₂ per revenue dollar (target: <0.5 tons/$1M).
- Water Usage Efficiency: Compare liters per product unit against industry leaders.
- Supplier Sustainability Scores: Audit 90% of suppliers for ESG compliance.
-
Cybersecurity Resilience Benchmarking: Zero Trust Maturity
Firms benchmark Zero Trust adoption using frameworks like NIST SP 800-207 and CIS Controls. Google Cloud achieved 98% compliance with Zero Trust principles, reducing data breaches by 60% (source: Google Security Blog, 2023). Methodology:
- Identity Verification Rates: Benchmark multi-factor authentication (MFA) usage (>95%).
- Threat Detection Latency: Measure <10 minutes for advanced persistent threat (APT) identification.
- Incident Containment Time: Target <4 hours for critical vulnerabilities.
-
Digital Transformation Benchmarking: Cloud Migration ROI
Enterprises benchmark cloud cost efficiency and agility using metrics like Total Cost
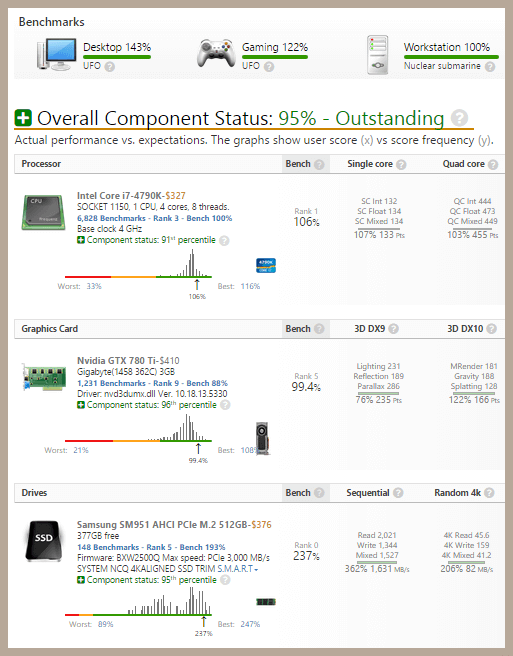
Methods and Tools for Conducting Benchmarking
Benchmarking transforms raw performance data into strategic insights by systematically comparing an organization’s processes, products, or services against industry leaders or best practices. The effectiveness of benchmarking hinges on the rigor of its methodology and the sophistication of the tools employed. A well-structured benchmarking process ensures accuracy, while the right tools—whether traditional or AI-driven—enhance scalability, precision, and actionability. Below, the step-by-step execution of a benchmarking study is outlined, followed by a comparative analysis of tools and a framework for designing a customer experience benchmarking initiative.
Step-by-Step Process of Conducting a Benchmarking Study
A structured benchmarking study follows a sequential approach to minimize bias and maximize reliability. The process begins with planning and scoping, where objectives are defined (e.g., operational efficiency, customer satisfaction), and ends with implementation and continuous improvement, where findings are translated into actionable strategies.1. Define Objectives and Scope
Establish clear goals aligned with organizational priorities. For example, a retail chain may aim to benchmark inventory turnover rates against competitors to reduce stockouts. Scope should specify:
- Processes or metrics to benchmark (e.g., delivery speed, employee turnover).
- Comparison groups (direct competitors, industry averages, internal departments).
- Timeframe (historical vs. real-time data).
2. Identify Benchmarking Partners
Select peer organizations or data sources that represent best practices. Partners may include:
- Competitors (publicly available financial reports, customer reviews).
- Industry associations (e.g., Gartner for IT benchmarking, McKinsey for operational metrics).
- Third-party providers (e.g., Nielsen for consumer behavior, Deloitte for supply chain KPIs).
3. Gather Data from Reliable Sources
Collect both primary data (direct surveys, interviews, internal audits) and secondary data (public reports, government statistics). Ensure data is:
- Comparable (standardized units, consistent time periods).
- Validated (cross-verified with multiple sources).
- Anonymized (to protect sensitive information).
4. Analyze and Compare Performance
Use statistical tools to identify gaps. Key techniques include:
- Ratio analysis (e.g., revenue per employee vs. industry average).
- Trend analysis (tracking performance over time).
- Gap analysis (quantifying differences between current and best-in-class metrics).
5. Develop Action Plans
Translate findings into SMART goals (Specific, Measurable, Achievable, Relevant, Time-bound). For instance, if a benchmark reveals a 20% higher customer retention rate at a competitor, the action plan might include:
- Implementing a loyalty program.
- Training staff on upselling techniques.
- Redesigning the checkout process.
6. Implement and Monitor Progress
Deploy changes incrementally and track KPIs to measure improvement. Use control charts or dashboard tools (e.g., Power BI, Tableau) to visualize progress against benchmarks.7. Institutionalize Benchmarking
Embed benchmarking into continuous improvement cycles (e.g., annual reviews, agile sprints). Document lessons learned and update frameworks as industry standards evolve.
Comparison of Traditional vs. AI-Driven Benchmarking Tools
The choice of benchmarking tools depends on data complexity, budget, and organizational maturity. Traditional tools rely on manual processes, while AI-driven platforms automate analysis and uncover hidden patterns. Below is a comparative table highlighting their pros and cons:
Key Consideration for Tool Selection:Tool Category Examples Pros Cons Best Use Case Traditional Tools - Spreadsheets (Excel, Google Sheets)
- Enterprise Resource Planning (ERP) systems (SAP, Oracle)
- Customer Relationship Management (CRM) platforms (Salesforce)
- Low cost and easy to implement.
- Full control over data and customization.
- No dependency on external vendors.
- Time-consuming for large datasets.
- Prone to human error in manual entry.
- Limited advanced analytics (e.g., predictive modeling).
Small to medium-sized organizations with straightforward benchmarking needs (e.g., comparing sales metrics across regions). AI-Driven Analytics Platforms - AI-powered benchmarking suites (e.g., IBM Watson Benchmarking, SAS Advanced Analytics)
- Cloud-based BI tools (e.g., Microsoft Power BI with AI insights, Tableau Prep)
- Specialized SaaS platforms (e.g., Benchmarking.com, Gartner Peer Insights)
- Automates data collection and analysis, reducing manual effort.
- Identifies non-obvious patterns (e.g., sentiment analysis in customer feedback).
- Real-time updates and predictive insights (e.g., forecasting future performance).
- Scalable for enterprise-level benchmarking.
- High implementation and maintenance costs.
- Requires technical expertise to configure and interpret AI outputs.
- Data privacy concerns with cloud-based solutions.
Large enterprises or industries with high data velocity (e.g., fintech, healthcare, e-commerce) requiring dynamic benchmarking. Select tools based on data volume, analytical depth required, and organizational readiness for AI adoption. Hybrid approaches—combining spreadsheets for ad-hoc analysis with AI for trend forecasting—are increasingly common.
Designing a Benchmarking Framework for Customer Experience
A customer experience (CX) benchmarking framework evaluates how well an organization meets customer expectations compared to industry leaders. Below is a structured approach to designing such a framework, including KPIs, data sources, and implementation steps.1. Define CX Benchmarking Objectives
Align goals with business outcomes, such as:
- Reducing customer churn by 15% through improved support responsiveness.
- Increasing Net Promoter Score (NPS) from 50 to 75 by enhancing personalization.
2. Select Key Performance Indicators (KPIs)
Focus on quantitative and qualitative metrics across the customer journey. Examples include:
Category KPI Data Source Benchmarking Target Customer Acquisition Cost per Lead (CPL) Marketing automation tools (HubSpot), CRM (Salesforce) Industry average CPL (e.g., $30 for SaaS vs. $100 for financial services). Customer Retention Customer Lifetime Value (CLV) ERP systems, subscription analytics Top 20% performers in the sector (e.g., Amazon’s CLV is ~$1,400 per customer). Support Efficiency First Response Time (FRT) Helpdesk software (Zendesk, Freshdesk) Competitor FRT (e.g., Apple’s average FRT: <1 hour vs. industry average: 3 hours). Satisfaction Net Promoter Score (NPS) Post-interaction surveys (Typeform, SurveyMonkey) NPS leaders in the industry (e.g., USAA: 78, vs. banking average: 20). Loyalty Benchmarking Metrics and Key Performance Indicators (KPIs)
Benchmarking metrics and Key Performance Indicators (KPIs) serve as the quantitative foundation for evaluating organizational performance against industry standards, competitors, or best practices. These metrics transform qualitative insights into actionable data, enabling organizations to identify gaps, optimize processes, and drive continuous improvement. The selection of KPIs must align with strategic objectives, industry-specific challenges, and the operational scale of the business—whether a small enterprise or a multinational corporation. Effective benchmarking relies on precise calculations, trend analysis, and real-time visualization to ensure decision-makers can monitor progress and adapt strategies dynamically.
Categorization of Essential Benchmarking Metrics Across Industries
Benchmarking metrics vary by industry due to distinct operational priorities, regulatory requirements, and customer expectations. Below is a table of 10 essential metrics categorized by industry, including their calculation methods and interpretations. These metrics are derived from industry standards (e.g., ISO, Six Sigma, EFQM) and empirical best practices.
The selection of these metrics depends on industry-specific goals (e.g., quality in semiconductors vs. customer retention in SaaS) and operational maturity. For example, a semiconductor plant prioritizes DPM and MTBF, while a retail chain focuses on Inventory Turnover and NPS.Metric Name Industry Calculation Method Interpretation Defects Per Million (DPM) Manufacturing, Semiconductors, Automotive DPM = (Total Defects / Total Units Produced) × 1,000,000
Measures process quality; lower DPM indicates higher reliability. A target of <65 DPM (Six Sigma standard) signifies near-perfect quality. Customer Acquisition Cost (CAC) Retail, E-commerce, SaaS CAC = (Total Marketing & Sales Costs) / (Number of New Customers Acquired in Period)
Evaluates marketing efficiency; lower CAC relative to Customer Lifetime Value (CLV) indicates sustainable growth. First-Time Fix Rate (FTFR) IT Services, Customer Support, Field Service FTFR = (Number of Issues Resolved in First Attempt) / (Total Issues) × 100%
Reflects operational efficiency; higher FTFR reduces costs and improves customer satisfaction. Inventory Turnover Ratio Retail, Wholesale, Logistics Inventory Turnover = Cost of Goods Sold (COGS) / Average Inventory Value
Indicates inventory management efficiency; higher ratios suggest faster sales and lower holding costs. Net Promoter Score (NPS) All Customer-Facing Industries (B2B/B2C) NPS = % of Promoters (9-10) – % of Detractors (0-6)
Gauges customer loyalty; scores above 50 indicate strong brand advocacy. Mean Time Between Failures (MTBF) Manufacturing, Aerospace, Healthcare Devices MTBF = Total Operating Time / Number of Failures
Measures equipment reliability; higher MTBF reduces downtime and maintenance costs. Employee Turnover Rate All Industries (HR Focus) Turnover Rate = (Number of Separations / Average Number of Employees) × 100%
Reflects workforce stability; rates below 10% are typically considered healthy. Cycle Time Manufacturing, Software Development, Construction Cycle Time = (End Time – Start Time) for a Process/Task
Assesses operational efficiency; reductions in cycle time improve throughput and responsiveness. Return on Investment (ROI) for Training Education, Corporate Training, Healthcare ROI = [(Benefits from Training – Training Costs) / Training Costs] × 100%
Evaluates the financial impact of training programs; positive ROI justifies investment. Energy Efficiency Ratio (EER) Utilities, Manufacturing, Real Estate EER = (Useful Energy Output) / (Energy Input)
Measures sustainability; higher EER indicates lower energy waste and cost savings.
Selecting KPIs for Small Businesses vs. Multinational Corporations
The choice of KPIs must account for scalability, data availability, and strategic alignment. Small businesses and multinational corporations (MNCs) face distinct challenges in benchmarking due to differences in resource allocation, market reach, and complexity.For Small Businesses:
-
Specificity Over Volume: Small businesses should prioritize actionable, low-cost metrics that directly impact revenue or customer satisfaction. Examples include:
- Customer Retention Rate (critical for limited customer bases).
- Gross Margin per Product Line (identifies profitable segments).
- Time-to-Market for New Products (competitive agility).
- Benchmarking Against Peers: Small businesses may lack access to industry-wide data, so they should focus on internal benchmarks (e.g., year-over-year improvements) or regional competitors. Tools like SCORE (Service Corps of Retired Executives) or local industry associations provide comparable data.
- Scalability Considerations: Metrics should be easy to replicate as the business grows. For example, tracking CAC early allows for scaling marketing strategies later.
-
Granularity and Standardization: MNCs require global consistency in KPIs to ensure uniformity across subsidiaries. Examples include:
- Global Supply Chain Lead Time (standardized across regions).
- Employee Productivity by Region (adjusted for local labor laws).
- Cross-Border Customer Satisfaction (CSAT) Scores (culturally adapted surveys).
- Benchmarking Against Industry Leaders: MNCs often compare against global benchmarks (e.g., Fortune 500 standards) or internal best practices (e.g., "best-performing subsidiary"). Tools like Gartner or Deloitte benchmarks provide external comparisons.
-
Advanced Analytics: MNCs leverage predictive modeling (e.g., forecasting DPM
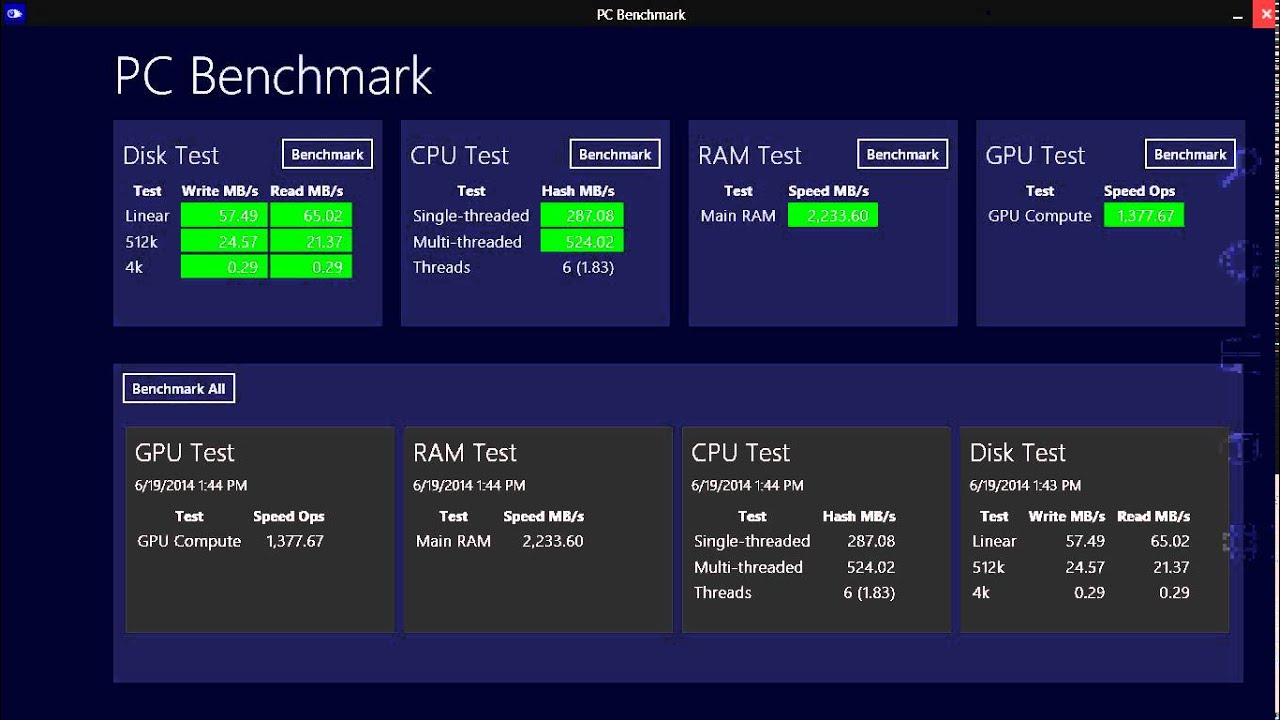
Benchmarking in Technology and Software Development
Benchmarking in technology and software development serves as a critical mechanism for quantifying system performance, identifying inefficiencies, and ensuring alignment with user expectations. Software teams leverage benchmarks to evaluate key metrics such as latency, throughput, scalability, and resource utilization, enabling data-driven optimizations that enhance reliability, security, and user experience. The integration of benchmarking tools—ranging from open-source solutions like JMeter to proprietary platforms such as LoadRunner—provides granular insights into system behavior under controlled and real-world conditions. This section explores the methodologies, tools, and practical applications of benchmarking in software development, emphasizing the distinction between synthetic benchmarks and real-user monitoring (RUM) to address performance bottlenecks effectively.
Performance Metrics and Benchmarking Tools in Software Development
Software performance benchmarks focus on measurable attributes that directly impact user interaction and system stability. Latency (response time) and throughput (transactions per second) are foundational metrics, while scalability (ability to handle increased load) and resource efficiency (CPU, memory, I/O usage) are critical for long-term system health. Tools like Apache JMeter, Locust, and k6 are widely adopted for load testing, simulating thousands of concurrent users to stress-test applications. Proprietary alternatives, such as NeoLoad or Silk Performer, offer advanced features like AI-driven analysis and enterprise-grade support but often at a higher cost.Benchmarking tools are categorized based on their use case:
- Load Testing Tools: Simulate high-traffic scenarios to assess system limits (e.g., JMeter, LoadRunner).
- Synthetic Monitoring Tools: Continuously probe APIs or endpoints to detect anomalies (e.g., Synthetic Monitoring in New Relic).
- Real-User Monitoring (RUM): Capture actual user interactions to identify real-world performance issues (e.g., Google Analytics, Datadog RUM).
Key Metric Definitions:
- Latency: Time taken for a request to complete (measured in milliseconds).
- Throughput: Number of operations processed per unit time (e.g., requests/second).
- Scalability: System’s ability to maintain performance under increased load (horizontal vs. vertical scaling).
- Resource Utilization: CPU, memory, and disk I/O consumption during benchmarking.
- Define Scope: Identify critical user journeys (e.g., login, checkout, API calls).
- Baseline Metrics: Record initial performance using tools like Google PageSpeed Insights.
- Environment Setup: Use a staging server mirroring production (identical OS, dependencies, and configurations).
- Performance Score (0–100): Aggregated metric combining First Contentful Paint (FCP), Time to Interactive (TTI), and more.
- Opportunities: Suggestions for optimizations (e.g., "Eliminate render-blocking resources").
- Diagnostics: Waterfall charts showing load times for assets (CSS, JS, images).
- First View vs. Repeat View: Measures cold vs. warm cache performance.
- Filmstrip: Visual timeline of page rendering.
- Resource Breakdown: Latency by region (e.g., DNS lookup, TCP handshake).
- Add HTTP Request Defaults (target URL, protocol).
- Configure Thread Group (e.g., 1,000 users, ramp-up 300 sec).
- Include Listeners (e.g., Summary Report, Aggregate Graph). 2. Execute Test:
- Response Times: 90th percentile latency (ignores outliers).
- Throughput: Requests/sec under load.
- Errors: HTTP 5xx responses indicating server failures.
- Geographic Heatmaps: User locations with high latency.
- Session Replays: Visual recordings of slow interactions.
- Correlation Analysis: Links performance degradation to specific code changes.
- Informed Consent and Data Governance: Ensure all benchmarking data—whether internally generated or sourced externally—complies with regulations such as GDPR, CCPA, or industry-specific standards (e.g., HIPAA for healthcare). Implement data anonymization techniques where applicable to protect individual or organizational identities.
- Transparency in Methodology: Document benchmarking processes, including data sources, sampling methods, and analytical techniques, to preempt accusations of manipulation or unfair advantage.
- Confidentiality Agreements: For collaborative benchmarking (e.g., industry consortia or third-party audits), enforce legal agreements to restrict unauthorized disclosure of raw data or comparative insights.
- Ethical Sourcing: Avoid benchmarking against organizations with unethical practices (e.g., labor violations, environmental harm) unless the intent is to drive industry-wide improvement through collective accountability.
- Stakeholder Communication: Clearly articulate the purpose of benchmarking to employees, partners, and customers to manage expectations and reduce perceptions of surveillance or exploitation.
- Internal Use: Ideal for operational improvements, employee engagement, or pilot programs where raw data sensitivity is high.
- External Use: Justified for industry leadership positioning, investor relations, or compliance reporting, but requires risk assessments for competitive retaliation or misrepresentation.
- Hybrid Approaches: Example: Publishing aggregated trends (e.g., "Top 20% of firms in sector X improved efficiency by 15%") while withholding proprietary details.
- Corporate Vision/Mission Statements: Link benchmarking KPIs to overarching goals (e.g., "Achieve industry-leading customer satisfaction within 3 years").
- Balanced Scorecards: Integrate benchmarking metrics (e.g., operational efficiency, innovation speed) into financial and non-financial performance frameworks.
- Roadmaps for Digital Transformation: Use benchmarking to identify gaps in technology adoption (e.g., AI integration, cybersecurity resilience) and prioritize investments.
- Benchmark energy consumption against peers to set reduction targets.
- Compare waste-management practices to identify best-in-class solutions.
- Integrate findings into the ESG (Environmental, Social, Governance) report to attract ethical investors.
- Benchmarking Literacy Workshops: Teach cross-functional teams how to interpret benchmarking data, identify improvement opportunities, and contribute to process redesign. Example: A Lego Serious Play® session where employees map their workflows against industry standards.
- Gamification: Use leaderboards (e.g., "Department X improved by 5% vs. industry average") to encourage healthy competition. Tools like Miro or Trello can visualize progress collaboratively.
- Mentorship Programs: Pair high performers with lagging teams to share insights from benchmarking analyses (e.g., "How Team A reduced cycle time by adopting Method Y").
- Benchmarking Task Forces: Assemble teams from operations, IT, and finance to co-develop improvement plans. Example: A hospitality chain benchmarking guest experience metrics across front-desk, housekeeping, and digital channels.
- Cross-Industry Learning: Organize benchmarking summits where employees from unrelated departments (e.g., HR and supply chain) share lessons from external comparisons.
- Agile Benchmarking Cycles: Replace annual reviews with quarterly sprints where teams rapidly test improvements against benchmarks (e.g., "Pilot a new customer feedback system and compare NPS scores").
- Genchi Genbutsu ("Go and See"): Employees visit benchmarked sites (e.g., Tesla’s automation plants) to observe best practices firsthand.
- Standardized Work (SW) Benchmarking: Processes are continuously refined by comparing them to industry leaders, with deviations flagged for root-cause analysis.
- Employee Empowerment: The "5 Whys" technique is used to drill down into benchmarking gaps, fostering ownership at all levels.
- Participation
Benchmarking is more than a tool for measurement—it is a strategic discipline that bridges the gap between aspiration and achievement. By systematically comparing performance against internal targets, competitors, or best-in-class practices, organizations unlock opportunities for efficiency, innovation, and resilience. The process demands rigor in data collection, ethical considerations in implementation, and a commitment to translating insights into tangible improvements. From the precision of semiconductor defect rates to the agility of web application performance, benchmarks provide the clarity needed to navigate complexity. Ultimately, its power lies in its ability to turn data into a catalyst for sustained growth, ensuring that organizations not only meet standards but redefine them.
Open-Source vs. Proprietary Benchmarking Tools: Suitability by Project Stage
The choice between open-source and proprietary benchmarking tools depends on project requirements, budget, and maturity. Open-source solutions (e.g., JMeter, Gatling, k6) are ideal for development and testing phases due to their flexibility, cost-effectiveness, and active community support. They allow custom scripting (e.g., Groovy in JMeter) and integration with CI/CD pipelines. Proprietary tools (e.g., LoadRunner, NeoLoad, BlazeMeter) are preferred in production environments for their advanced analytics, enterprise scalability, and dedicated customer support. Below is a comparative analysis:
For startups or agile teams, open-source tools reduce overhead, while large-scale enterprises benefit from proprietary solutions’ robustness and compliance features.Criteria Open-Source Tools (e.g., JMeter, k6) Proprietary Tools (e.g., LoadRunner, NeoLoad) Cost Free; requires in-house expertise for setup. Licensing fees; often includes professional services. Use Case Development, QA, and CI/CD integration. Enterprise production monitoring and compliance reporting. Scalability Limited by hardware; distributed testing requires manual configuration. Cloud-based scalability with automated load distribution. Features Customizable scripts, protocol support (HTTP, WebSocket), and plugin ecosystem. AI-driven insights, real-time dashboards, and integration with APM tools. Learning Curve Moderate; requires scripting knowledge for advanced use. Lower for basic use; advanced features demand training.
Step-by-Step Guide to Benchmarking a Web Application’s Speed
Benchmarking web application performance involves automated testing with tools like Lighthouse (Chrome DevTools) or WebPageTest (multi-location testing). Below is a structured approach to assessing speed, including tool-specific commands and expected outputs:### 1. Pre-Benchmarking Preparation
### 2. Automated Benchmarking with Lighthouse
Lighthouse audits performance, accessibility, SEO, and best practices. Run via:# Chrome CLI (Headless Mode)
chrome --headless --disable-gpu --remote-debugging-port=9222 https://example.com &
lighthouse https://example.com --output=html --output-path=./report.htmlExpected Output:
### 3. Multi-Location Testing with WebPageTest
WebPageTest provides geographically distributed testing (e.g., US, EU, Asia). Execute via:# WebPageTest API (Node.js Example)
const WebPageTest = require('webpagetest');
const instance = new WebPageTest('https://www.webpagetest.org');
instance.runTest({
url: 'https://example.com',
f: 'html,json',
locations: 'DUL:Dulles,USA',
browsers: 'Chrome',
connect: '4G'
}, (err, data) => {
console.log(data); // JSON with detailed metrics
});Expected Output:
### 4. Load Testing with JMeter
Simulate concurrent users to test scalability. Key steps:
1. Create a Test Plan:
jmeter -n -t test_plan.jmx -l results.jtl
3. Analyze Results:
Synthetic Benchmarks vs. Real-User Monitoring (RUM): Identifying Performance Bottlenecks
Synthetic benchmarks and RUM serve distinct but complementary roles in performance analysis. Synthetic benchmarks (e.g., JMeter scripts, LoadRunner) simulate controlled user loads to identify systemic issues such as database bottlenecks or misconfigured caching. They are deterministic and reproducible, ideal for proactive optimization during development or pre-deployment.In contrast, Real-User Monitoring (RUM) captures actual user interactions, revealing real-world bottlenecks like slow third-party scripts, regional latency, or device-specific rendering issues. RUM tools (e.g., New Relic, Datadog) provide:
Key Differences:
Aspect Synthetic Benchmarks Real-User Monitoring (RUM) Data Source Simulated traffic Actual user sessions Use Case Pre-release testing, capacity planning Post-deployment diagnostics Granularity System-level metrics (CPU, DB queries) End-user Ethical and Strategic Considerations in Benchmarking
Benchmarking, while a powerful tool for organizational improvement, operates within a complex landscape of ethical obligations and strategic alignment. Ethical concerns—such as data misuse, competitive exploitation, and unintended reputational harm—must be addressed proactively to ensure transparency and fairness. Concurrently, benchmarking initiatives must integrate seamlessly with long-term business objectives to deliver sustainable value. This section examines the ethical risks inherent in benchmarking practices, outlines decision frameworks for result disclosure, and explores strategies to embed benchmarking within broader strategic and cultural frameworks.
Ethical Implications and Responsible Benchmarking Practices
Benchmarking relies on the collection, analysis, and comparison of performance data, which introduces ethical risks if not managed carefully. Key concerns include data privacy violations, where sensitive internal metrics or third-party data may be exposed without consent; competitive espionage, if proprietary benchmarking methodologies or industry secrets are misused; and bias or misrepresentation, where selective or manipulated data distorts perceptions of organizational performance. Additionally, cultural sensitivity may arise when benchmarking across global markets, where differing regulatory environments or stakeholder expectations necessitate tailored approaches.To mitigate these risks, organizations should adhere to the following principles:
"Ethical benchmarking is not merely compliance—it is a strategic imperative that builds trust, enhances reputation, and ensures long-term sustainability." — Institute of Internal Auditors (IIA) Benchmarking Guidelines, 2023
Decision Framework for Disclosing Benchmarking Results
The decision to disclose benchmarking results—whether internally, externally, or partially—depends on strategic objectives, risk tolerance, and stakeholder dynamics. Below is a text-based flowchart outlining the decision-making process, structured as a series of conditional steps:START
│
├─ Is the benchmarking initiative tied to a competitive advantage (e.g., market leadership, R&D innovation)?
│ │
│ ├─ Yes → Proceed to Internal Disclosure Only (restrict to leadership/operational teams)
│ │ │
│ │ ├─ Are there legal/regulatory barriers to external disclosure? (e.g., trade secrets, antitrust laws)
│ │ │ │
│ │ │ ├─ Yes → Confidential Internal Use (documented for audits)
│ │ │ │
│ │ │ └─ No → Selective External Disclosure (e.g., industry reports, press releases without raw data)
│ │ │
│ │ └─ No → Evaluate Strategic Alignment (see next step)
│ │
│ └─ No → Proceed to Strategic Alignment Assessment
│
├─ Does the benchmarking serve a public interest goal (e.g., sustainability, safety, compliance)?
│ │
│ ├─ Yes → Controlled External Disclosure (e.g., ESG reports, regulatory filings)
│ │ │
│ │ ├─ Is there a risk of reputational harm if results are misinterpreted? (e.g., lagging performance)
│ │ │ │
│ │ │ ├─ Yes → Frame with Context (e.g., "Improving from X% to Y% through initiative Z")
│ │ │ │
│ │ │ └─ No → Full Transparency (public dashboards, open-data initiatives)
│ │ │
│ │ └─ No → Internal Focus (use for internal improvement without external exposure)
│ │
│ └─ No → Internal Review Only (unless aligned with broader corporate messaging)
│
└─ ENDKey Considerations for Disclosure Decisions:
Aligning Benchmarking with Long-Term Business Goals
Benchmarking initiatives must transcend short-term tactical gains to contribute meaningfully to strategic planning documents such as:
Strategic Integration Workflow:
1. Goal Decomposition: Break down long-term goals into measurable components (e.g., "Reduce supply chain costs by 20%" → benchmark against logistics leaders).
2. Benchmarking as a Diagnostic Tool: Identify root causes of performance gaps (e.g., process inefficiencies, skill deficits) and align corrective actions with strategic initiatives.
3. Resource Allocation: Justify budget requests for benchmarking-driven improvements (e.g., ERP upgrades, training programs) by demonstrating ROI through comparative analysis.
4. Scenario Planning: Use benchmarking data to simulate future states (e.g., "If we adopt Firm A’s lean methodology, we could achieve a 12% cost reduction").Example: A manufacturing firm aligning benchmarking with its sustainability strategy might:
Fostering a Culture of Continuous Improvement Through Benchmarking
Benchmarking is most effective when it becomes a cultural norm rather than a periodic exercise. Organizations can cultivate this mindset through:Employee Training Programs
Cross-Departmental Collaboration Frameworks
Case Study: Toyota’s Continuous Improvement Culture
Toyota’s Kaizen philosophy leverages benchmarking by:
Key Metrics to Track Cultural Adoption:
FAQ
what is a benchmark fraction?
Q: What does the term "benchmark fraction" mean in mathematics or statistics?
what is a benchmark test?
Q: What is a benchmark test, and how is it used in education?
what is a benchmark in surveying?
Q: What is a benchmark in surveying, and why is it important?
what is a benchmark run?
Q: What is a benchmark run in software or performance testing?
what is a benchmark in construction?
Q: What does "benchmark" mean in the context of construction or engineering?
what is a benchmark bowling ball?
Q: What is a benchmark bowling ball, and how is it different from others?
Leave a Comment
Comments are moderated before appearing. The data you submit is processed according to the Privacy Policy of Voltefac.