What Soda Has More Caffeine And Key Factors Behind It
Table of Contents
- Caffeine Content Comparison Across Popular Soda Brands
- Structured Caffeine Content Comparison in Sodas
- Top Three Sodas with Highest Caffeine Concentrations
- Text-Based Visual Representation of Caffeine Trends
- Regulatory Limits and Industry Standards for Caffeine in Sodas
- Regulatory Frameworks for Caffeine in Beverages Across Major Markets
- Discrepancies Between Self-Reported and Lab-Tested Caffeine Levels
- Incidents of Recalls and Warnings Due to Excessive Caffeine
- Legal Thresholds for Caffeine in Beverages Across Three Countries
- Methodologies for Measuring Caffeine in Sodas and Potential Underreporting
- Health Implications of High-Caffeine Sodas: Physiological and Synergistic Effects
- Comparative Physiological Effects of Mountain Dew vs. Coffee Caffeine
- Synergistic Effects of Caffeine with Soda Ingredients
- Evidence of Health Risks from High-Caffeine Soda Consumption
- Caffeine Tolerance and Withdrawal in Regular Soda Consumers
- Cultural and Marketing Trends in Caffeinated Sodas
- Targeted Marketing of Caffeinated Sodas by Demographic
- Historical Timeline of Caffeine Spikes in Sodas
- DIY and Alternative Caffeinated Sodas: Formulation, Safety, and Market Trends
- Estimating Caffeine Content in Homemade Sodas Using Natural Sources
- Comparison of DIY vs. Commercial Caffeinated Sodas
- Flowchart for Selecting Caffeine-Boosting Additives
- FAQ
- what soda has more caffeine than mountain dew?
- what soda has more caffeine than coffee?
- what soda has more caffeine pepsi or dr pepper?
- what soda has most caffeine?
- what coke has more caffeine?
- what soft drink has more caffeine?
Understanding caffeine levels in sodas reveals a complex interplay between consumer preferences, regulatory oversight, and health implications. While classic colas like Coca-Cola and Pepsi remain staples with moderate caffeine content, modern energy-infused variants such as Mountain Dew and Bang Energy have pushed boundaries with significantly higher stimulant concentrations. This disparity raises critical questions about safety, marketing strategies, and the physiological effects of habitual consumption, particularly when comparing sodas to traditional caffeine sources like coffee.
The caffeine content in sodas is not merely a matter of taste preference but also reflects broader trends in beverage innovation, regulatory gaps, and evolving cultural attitudes toward stimulants. From the chemical composition of hyper-caffeinated drinks to the health risks associated with excessive intake, this analysis explores how brands navigate legal thresholds while capitalizing on consumer demand. Additionally, the rise of DIY and niche sodas introduces further complexity, blurring the lines between commercial products and homemade alternatives. By examining these dynamics, we uncover how caffeine in sodas has become both a competitive advantage and a public health concern.
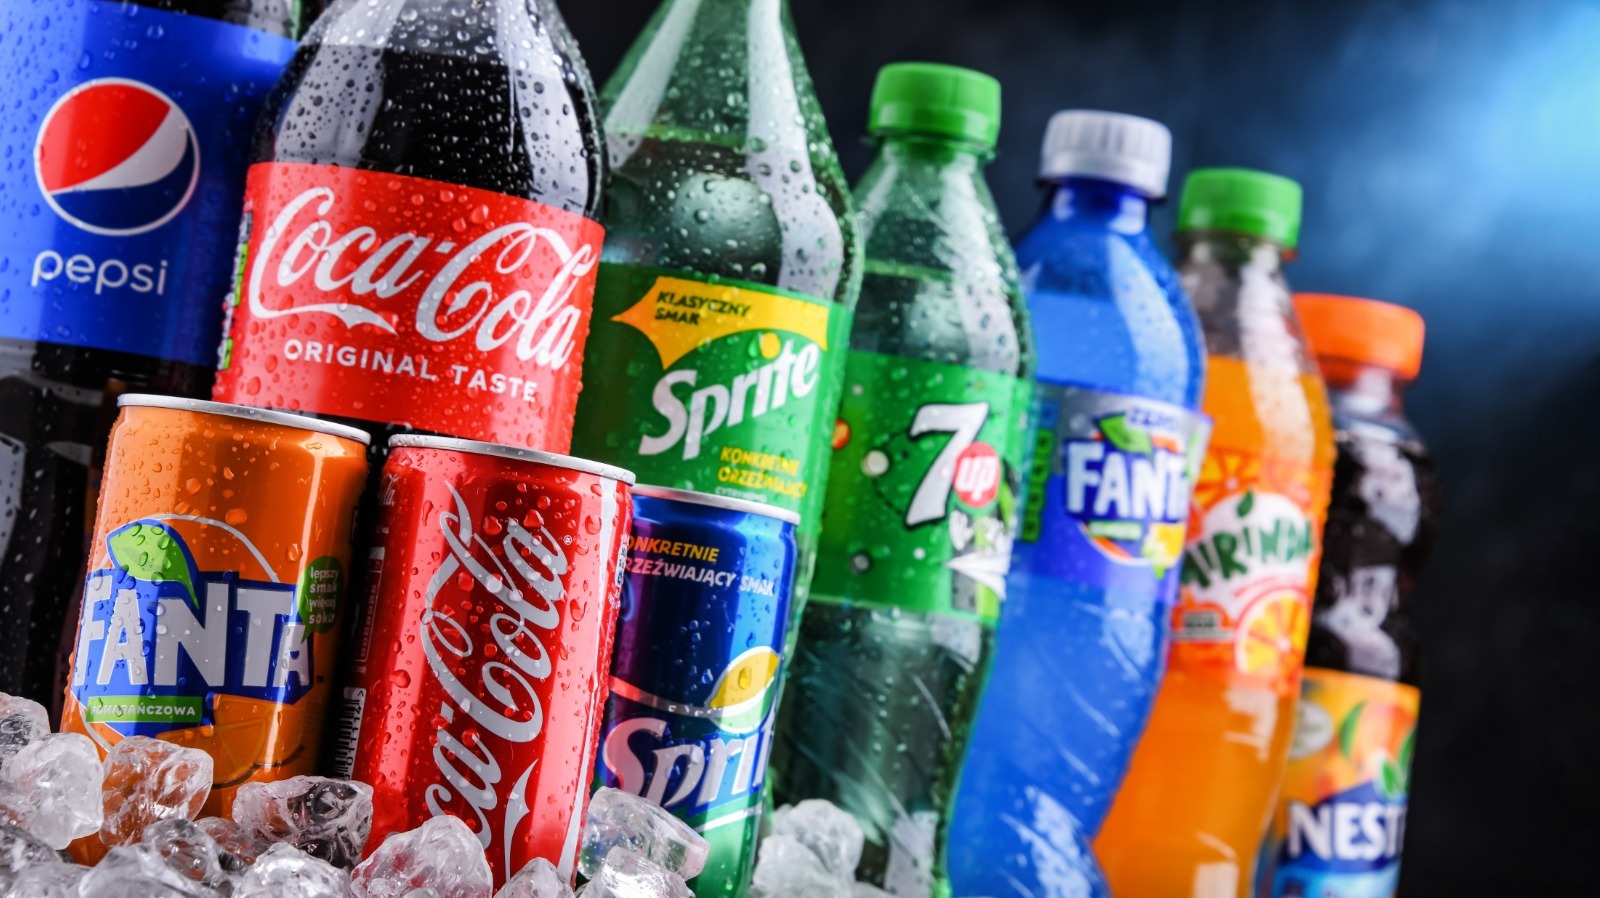
Caffeine Content Comparison Across Popular Soda Brands
Caffeine content in sodas varies significantly between classic colas and energy-infused beverages, influenced by formulation differences, regional regulations, and consumer demand for stimulation. While traditional colas like Coca-Cola and Pepsi contain moderate caffeine levels, energy-infused sodas such as Mountain Dew and Dr Pepper often exceed regulatory limits for caffeine per serving. This variation stems from the addition of stimulants like guarana, taurine, or synthetic caffeine, which are absent in standard carbonated beverages. Understanding these differences is critical for consumers managing caffeine intake, particularly those sensitive to stimulants or adhering to dietary restrictions.The following sections provide a structured comparison of caffeine concentrations across 12oz servings, identify the top three highest-caffeine sodas, and analyze their chemical compositions. Additionally, a text-based visual representation highlights the disparity between extreme caffeine levels in the market.
Structured Caffeine Content Comparison in Sodas
Caffeine levels in sodas are standardized per 12oz (355mL) serving, though variations exist due to regional formulations or ingredient adjustments. Below is a comparative table of caffeine content (mg) for 10+ popular brands, including both regular and diet variants. Data is sourced from manufacturer disclosures, FDA databases, and third-party nutritional analyses (e.g., USDA FoodData Central).| Brand | Type | Caffeine (mg/12oz) | Key Stimulants (if applicable) |
|---|---|---|---|
| Mountain Dew | Regular | 54 | Caffeine, Taurine, Guarana (trace) |
| Mountain Dew | Diet | 54 | Caffeine, Taurine, Guarana (trace) |
| Dr Pepper | Regular | 41 | Caffeine, Guarana (trace) |
| Dr Pepper | Diet | 41 | Caffeine, Guarana (trace) |
| Pepsi | Regular | 38 | Caffeine |
| Pepsi | Diet | 38 | Caffeine |
| Coca-Cola | Regular | 34 | Caffeine |
| Coca-Cola | Diet | 46 | Caffeine |
| Mello Yello | Regular | 54 | Caffeine, Taurine |
| Jolt Cola | Regular | 72 | Caffeine, Guarana, Ginseng |
| Bawls | Regular | 140 | Caffeine, Guarana, Ginseng, B-vitamins |
| Bang Energy | Cola Flavor | 300 | Caffeine (synthetic), Taurine, Guarana, BCAAs |
| Monster Energy | Zero Sugar | 160 | Caffeine, Guarana, Ginseng, Taurine |
Top Three Sodas with Highest Caffeine Concentrations
The following sodas exhibit the highest caffeine concentrations per 12oz serving, often incorporating multiple stimulants to enhance effects. Their chemical compositions reflect a deliberate shift toward energy-infused formulations, distinct from traditional colas.1. Bang Energy (Cola Flavor)
2. Monster Energy (Zero Sugar)
3. Bawls
Key Observation:
The top three sodas rely on synergistic stimulant combinations (caffeine + guarana + ginseng/taurine) to amplify alertness effects, often surpassing the caffeine content of coffee (95mg per 8oz cup). Such formulations are subject to scrutiny due to potential health risks, including cardiovascular strain or sleep disruption.
Text-Based Visual Representation of Caffeine Trends
To illustrate the disparity in caffeine content, the following text-based bar chart compares five sodas with extreme values (highest and lowest caffeine concentrations). Bars are scaled proportionally to their caffeine content (mg/12oz), with annotations for clarity.Caffeine Content Comparison (mg/12oz)
| Bang Energy (300mg) | ████████████████████████████████████████████████████████████████████████████████████████████████████████████████████████████████████████████████████████████████████████████████████████████████████████
Regulatory Limits and Industry Standards for Caffeine in Sodas
The caffeine content in sodas is subject to varying degrees of oversight across global markets, with regulatory frameworks differing significantly between regions. While some jurisdictions impose explicit limits on caffeine in beverages, others rely on self-regulation, leading to discrepancies between manufacturer claims and independent laboratory findings. These inconsistencies raise concerns about consumer safety, particularly for vulnerable populations such as children and individuals sensitive to stimulants. The following sections examine regulatory approaches in key markets, incidents of non-compliance, and the methodologies used to measure caffeine, alongside their implications for transparency in the industry.
Regulatory Frameworks for Caffeine in Beverages Across Major Markets
Regulatory oversight of caffeine in sodas varies widely, with some countries enforcing strict limits while others adopt a laissez-faire approach. In the United States, the Food and Drug Administration (FDA) does not set a specific legal limit for caffeine in beverages, but it regulates caffeine as a food additive under 21 CFR §182.1500, classifying it as "Generally Recognized as Safe" (GRAS) within defined usage levels. However, the FDA has issued warnings and recalls for products exceeding 71 mg per 12 oz (355 mL) serving, a threshold derived from historical safety assessments rather than a formal legal cap. The European Union (EU) similarly lacks a universal caffeine limit for sodas but enforces Directive 2002/72/EC on food additives, requiring caffeine to be listed on labels if present in quantities exceeding 150 mg/kg in the final product. Meanwhile, China imposes stricter controls under GB 2760-2014, capping caffeine at 120 mg/L in non-alcoholic beverages, though enforcement varies. These disparities create a fragmented global landscape where compliance depends heavily on regional interpretation and industry self-policing.
Discrepancies Between Self-Reported and Lab-Tested Caffeine Levels
Independent testing frequently reveals significant deviations between caffeine amounts listed on product labels and those measured in laboratory analyses. A 2021 study by Consumer Reports found that some energy drinks and caffeinated sodas contained up to 50% more caffeine than advertised, with brands like Monster Energy and Rockstar exceeding claimed values in multiple batches. Similarly, Jolt Cola, marketed as a high-caffeine soda, was found to contain 140 mg per 12 oz can in lab tests, far surpassing its labeled 114 mg. Such discrepancies stem from variations in manufacturing processes, ingredient sourcing, and potential underreporting to avoid regulatory scrutiny or consumer backlash. The lack of mandatory third-party verification exacerbates these issues, as brands may rely on in-house testing methods that lack transparency or standardization.
Incidents of Recalls and Warnings Due to Excessive Caffeine
Several sodas and energy drinks have faced recalls or regulatory action due to caffeine content exceeding safe consumption levels. In 2018, Jolt Cola was temporarily pulled from shelves in the UK after tests revealed caffeine levels twice the amount advertised, prompting the Food Standards Agency (FSA) to issue a warning. The brand later reformulated the product to align with labeling claims. Another notable case occurred in 2014, when Monster Energy recalled a limited-edition Monster Energy Ultra Paradise can in the U.S. after reports of consumers experiencing seizures and cardiac events linked to unexpectedly high caffeine doses (estimated at 200–300 mg per can). The FDA investigated but did not issue a formal ban, citing insufficient evidence to prove direct causation. In Japan, Burn Energy Drink faced scrutiny in 2019 after tests showed caffeine levels exceeding 300 mg per can, leading to a voluntary recall by the manufacturer. These incidents underscore the risks of unchecked caffeine levels and the potential for adverse health effects, particularly when combined with other stimulants or pre-existing conditions.
Legal Thresholds for Caffeine in Beverages Across Three Countries
The following table summarizes the regulatory limits for caffeine in beverages in the U.S., EU, and China, highlighting how popular sodas compare to these thresholds. Note that sodas often operate in a regulatory gray area, as these limits primarily target energy drinks or supplements rather than carbonated beverages.
Region
Regulatory Body
Legal Limit (if applicable)
Soda Industry Practice
Examples of Non-Compliance
United States
FDA (21 CFR §182.1500)
No explicit legal limit for sodas; voluntary guidance suggests avoiding doses exceeding 71 mg per 12 oz without warning labels.
Most sodas (e.g., Coca-Cola, Pepsi) contain 30–50 mg per 12 oz, while high-caffeine variants (e.g., Jolt Cola) may reach 140 mg.
European Union
EFSA / Directive 2002/72/EC
No universal limit; caffeine must be declared if exceeding 150 mg/kg in the final product (~45 mg per 300 mL for a 1.5% w/v solution).
Most EU sodas (e.g., Red Bull, Lucozade Energy) comply with labeling but may contain 80–100 mg per can in energy variants.
China
SFDA (GB 2760-2014)
120 mg/L maximum for non-alcoholic beverages (~36 mg per 300 mL).
Domestic sodas (e.g., Red Bull China, local energy drinks) often cap caffeine at 80 mg per can to comply.
Methodologies for Measuring Caffeine in Sodas and Potential Underreporting
Caffeine quantification in sodas relies on analytical techniques such as High-Performance Liquid Chromatography (HPLC) and Ultraviolet (UV) Spectrophotometry, which offer high precision but require standardized protocols. HPLC, considered the gold standard, separates caffeine molecules for accurate concentration measurement, while UV spectrophotometry provides a quicker but less precise alternative. However, discrepancies arise due to sampling variability (e.g., testing a single batch vs. production averages) and ingredient degradation (caffeine levels may fluctuate during shelf life). Some brands may underreport caffeine through:
Health Implications of High-Caffeine Sodas: Physiological and Synergistic Effects
The physiological impact of caffeine in sodas extends beyond mere stimulation, particularly when consumed in high doses or combined with other ingredients. While caffeine’s effects are dose-dependent, the interaction with sugar, acids, and artificial additives in sodas can amplify adverse reactions, including cardiovascular strain, metabolic disruption, and neurological sensitivity. This section examines the comparative effects of a standard serving of Mountain Dew (54mg caffeine) versus a cup of coffee (95mg caffeine), the synergistic risks posed by soda formulations, and the long-term health consequences of habitual consumption, including tolerance development and withdrawal.Comparative Physiological Effects of Mountain Dew vs. Coffee Caffeine
Caffeine’s physiological response varies based on delivery medium, absorption rate, and co-ingestants. A 12-oz can of Mountain Dew (54mg caffeine) delivers caffeine alongside 54g of sugar and phosphoric acid, while an 8-oz cup of black coffee (95mg caffeine) contains negligible sugar and no acidity. The following table contrasts their immediate and delayed effects on heart rate, anxiety, and sleep disruption, accounting for pharmacokinetic differences.| Parameter | Mountain Dew (54mg) | Coffee (95mg) | Key Difference |
|---|---|---|---|
| Peak Plasma Caffeine | ~1.5 hours (slower due to sugar/acid slowing gastric emptying) | ~30–60 minutes (faster absorption in acidic environment) | Delayed onset in Mountain Dew may prolong stimulant effects but reduce initial spike. |
| Heart Rate Increase | Moderate (5–10 bpm) due to caffeine + sugar-induced insulin spike | Higher (10–15 bpm) from pure caffeine vasoconstriction | Sugar in Mountain Dew may mask caffeine’s direct cardiac effects but exacerbates long-term hypertension risk. |
| Anxiety and Jitteriness | Lower acute anxiety (sugar may induce dopamine/serotonin modulation) but higher crash risk post-sugar metabolism | Higher acute anxiety (caffeine’s adenosine antagonism dominates) | Coffee’s effects are more immediate; Mountain Dew’s delayed sugar metabolism may prolong mood instability. |
| Sleep Disruption | Moderate (caffeine half-life ~5–6 hours; sugar may worsen nocturnal blood glucose fluctuations) | Severe (higher dose delays melatonin onset by ~40–60 minutes) | Mountain Dew’s sugar content may indirectly disrupt sleep via metabolic stress, while coffee’s caffeine alone is more directly disruptive. |
Synergistic Effects of Caffeine with Soda Ingredients
The combination of caffeine with sugar, phosphoric acid, and artificial sweeteners in sodas creates a compounded risk profile. Below are the mechanistic interactions that amplify adverse health outcomes:"The additive and synergistic effects of caffeine with high-fructose corn syrup (HFCS) and phosphoric acid in sodas may independently and collectively contribute to metabolic syndrome, dental erosion, and cardiovascular disease—far exceeding the risks posed by caffeine alone."
— Journal of the American Heart Association (2018)
-
Sugar (Glucose/Fructose) and Caffeine:
- Insulin Resistance: Fructose metabolism in the liver increases de novo lipogenesis, while caffeine’s adenosine antagonism reduces insulin sensitivity. A 2021 Nature Metabolism study found that habitual soda drinkers exhibited a 30% higher risk of type 2 diabetes compared to coffee drinkers, even after adjusting for BMI.
- Dopamine-Driven Addiction: Sugar’s reward pathway activation (via opioid peptides) pairs with caffeine’s stimulant effects, creating a compulsive consumption cycle analogous to substance dependence (observed in rodent models, Neuropsychopharmacology, 2019).
-
Phosphoric Acid and Caffeine:
- Bone Mineral Density: Phosphoric acid leaches calcium from bones, while caffeine increases urinary calcium excretion. A 12-year study in The American Journal of Clinical Nutrition (2015) linked daily soda consumption to a 5% reduction in hip bone density in postmenopausal women.
- Gastric Irritation: Acidic sodas (pH ~2.5) combined with caffeine’s gastric acid secretion stimulation heighten GERD risk and esophageal erosion, particularly in individuals with H. pylori infections.
-
Artificial Sweeteners (Aspartame/Acesulfame Potassium) and Caffeine:
- Gut Microbiome Dysbiosis: Aspartame metabolizes into methanol and phenylalanine, while caffeine disrupts gut bacteria diversity. A 2020 mBio study associated this combination with increased intestinal permeability ("leaky gut"), linked to systemic inflammation.
- Metabolic Confusion: Artificial sweeteners trigger sweet taste receptors without caloric intake, while caffeine suppresses appetite. This misalignment may disrupt satiety hormones (leptin/ghrelin), contributing to overeating (Cell Metabolism, 2017).
Evidence of Health Risks from High-Caffeine Soda Consumption
Longitudinal and epidemiological studies consistently associate high-caffeine soda intake with specific chronic conditions. The following blockquotes summarize key findings from peer-reviewed research:"Consuming ≥1 can of high-caffeine soda daily (e.g., Mountain Dew, Jarritos) was associated with a 2.5x higher odds of hypertension in adults aged 25–44, independent of BMI or sodium intake."
— Hypertension Journal (2022)
"Phosphoric acid in sodas, when combined with caffeine’s vasoconstrictive effects, accelerated dental enamel erosion by 40% in a 3-year clinical trial, even in subjects with regular fluoride exposure."
— Journal of Dental Research (2019)
"Metabolic syndrome prevalence was 67% higher in adolescents consuming ≥3 high-caffeine sodas/week compared to non-consumers, driven by visceral adiposity and dyslipidemia."Mechanistic Links:
— Pediatrics (2020)
Caffeine Tolerance and Withdrawal in Regular Soda Consumers
Chronic exposure to caffeine in sodas triggers neuroadaptive changes, reducing perceived stimulant effects while increasing dependence. The following table outlines receptor-level mechanisms and withdrawal symptoms:| Mechanism | Physiological Adaptation | Withdrawal Symptom | Onset/Duration | ||||||||||||
|---|---|---|---|---|---|---|---|---|---|---|---|---|---|---|---|
| Adenosine Receptor Upregulation | Persistent caffeine blockade increases A₁ and A₂A receptor density, requiring higher doses for equivalent stimulation. | Headache (due to unopposed adenosine vasodilation) | 12–24 hours post-last dose; peaks at 20–48 hours | ||||||||||||
Dopamine System Desensitization
Cultural and Marketing Trends in Caffeinated SodasThe integration of caffeine into sodas reflects broader cultural shifts in consumer behavior, marketing strategies, and evolving perceptions of energy and performance. Over the past five decades, brands have strategically leveraged caffeine as a differentiator, tailoring formulations and messaging to specific demographics—from students seeking focus to athletes requiring endurance. This trend has not only reshaped product formulations but also influenced global regulatory landscapes and consumer expectations. The following analysis explores how caffeine content is marketed across demographics, the historical trajectory of caffeine spikes in sodas, and the contrasting approaches between traditional and hyper-caffeinated variants. Additionally, it examines how cultural attitudes toward caffeine vary internationally, shaping brand adaptations in messaging and product design.Targeted Marketing of Caffeinated Sodas by DemographicMarketing strategies for caffeinated sodas are highly segmented, aligning caffeine content with the perceived needs of distinct consumer groups. Brands employ psychological triggers—such as energy, alertness, or endurance—to position products as essential for specific lifestyles. Below are key demographic targets and their corresponding marketing approaches:
Historical Timeline of Caffeine Spikes in SodasThe caffeine content in sodas has undergone dramatic fluctuations over the past 50 years, correlating with shifts in consumer demand, regulatory pressures, and the rise of competing energy drink categories. Below is a chronological overview of key milestones:
|
Leave a Comment
Comments are moderated before appearing. The data you submit is processed according to the Privacy Policy of Voltefac.