What Troponin Level Indicates Heart Attack Diagnostic Guidelines And Clini
Table of Contents
- Troponin Levels in Acute Coronary Syndromes: Diagnostic Thresholds and Clinical Interpretation
- Physiological Role and Release Kinetics of Troponin in Myocardial Injury
- Diagnostic Thresholds for Troponin in Acute Myocardial Infarction: Comparative Analysis of Guidelines
- High-Sensitivity Troponin Assays: Enhancing Early Detection of Myocardial Infarction
- Case Study: Differential Diagnosis in the Troponin Grey Zone (18–52 ng/L hs-TnT)
- Dynamic Changes in Troponin: Patterns and Timing for Heart Attack Confirmation
- Kinetic Profile of Troponin Release Post-MI
- Troponin Trends Across ACS Subtypes: Comparative Analysis
- Regional Wall Motion Abnormalities and Troponin Release Patterns
- False Positives and Negatives: Troponin Elevations Beyond Acute Myocardial Infarction
- Categorized Non-Cardiac Causes of Troponin Elevation
- FAQ
- What troponin level is considered indicative of a heart attack in Australia?
- What troponin level suggests a heart attack in the UK?
- What troponin levels are used to diagnose a heart attack in Canada?
- What troponin level in pg/mL indicates a heart attack?
- What troponin level in ng/L indicates a heart attack?
- What troponin levels do people on Reddit say indicate a heart attack?
Cardiac troponin levels serve as the gold standard for diagnosing myocardial infarction, yet interpreting their thresholds remains critical in distinguishing acute coronary syndromes from non-ischemic etiologies. The release of troponin I (TnI) and troponin T (TnT) into circulation following myocardial injury provides clinicians with a sensitive biomarker for early detection, though variability in assay sensitivity and patient-specific factors complicates diagnostic precision. High-sensitivity troponin assays have revolutionized risk stratification by identifying subtle elevations missed by conventional tests, yet their clinical utility hinges on understanding dynamic trends, kinetic profiles, and contextual adjustments for comorbidities. This analysis explores evidence-based thresholds from global guidelines, troponin kinetics across heart attack subtypes, and differential diagnoses for ambiguous elevations—equipping practitioners to navigate diagnostic ambiguity with confidence.
The diagnostic landscape of troponin interpretation has evolved significantly with advancements in high-sensitivity assays, now enabling detection of myocardial necrosis at concentrations previously deemed subclinical. Key guidelines from the European Society of Cardiology (ESC), American College of Cardiology/American Heart Association (ACC/AHA), and National Institute for Health and Care Excellence (NICE) provide structured cutoffs, yet their application requires consideration of renal function, assay variability, and temporal trends. For instance, while the 99th percentile of the upper reference limit (URL) remains a foundational threshold, serial measurements are indispensable for confirming acute myocardial infarction (MI) in patients presenting with chest pain or ECG abnormalities. This discussion dissects the physiological underpinnings of troponin release, compares assay-specific thresholds, and examines how regional myocardial damage influences biomarker dynamics—offering a framework for clinicians to integrate troponin data into comprehensive diagnostic workflows.
Troponin Levels in Acute Coronary Syndromes: Diagnostic Thresholds and Clinical Interpretation
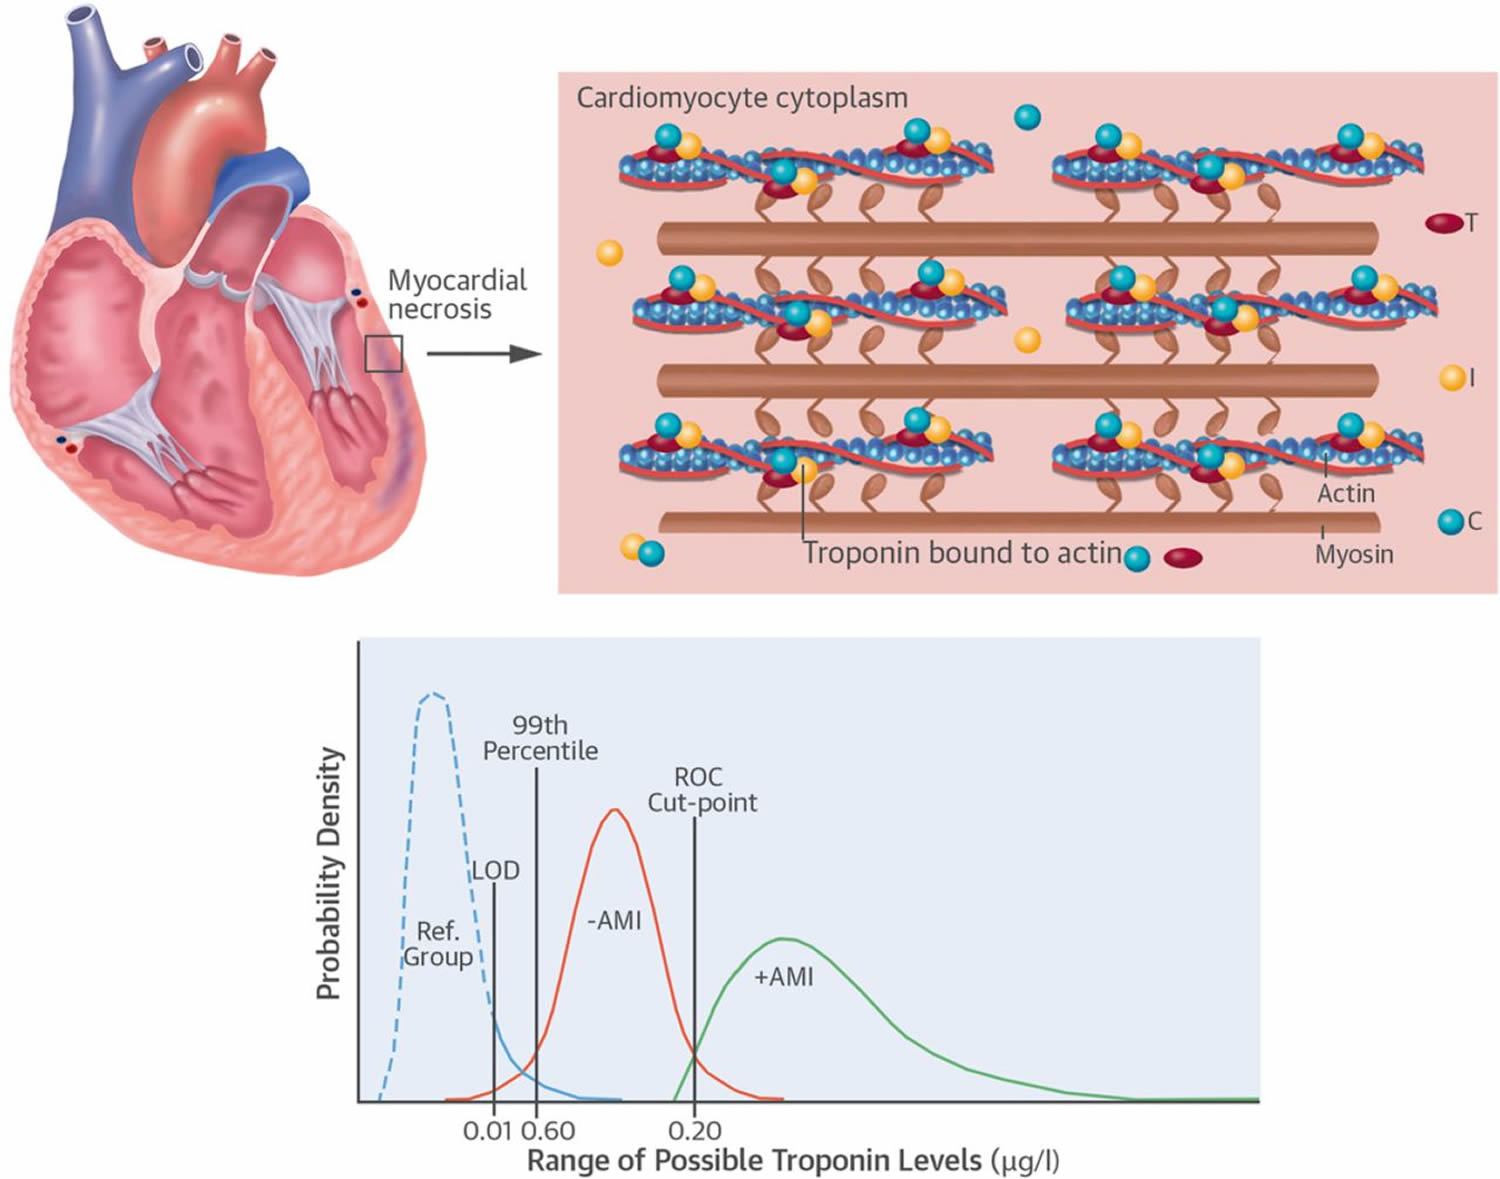
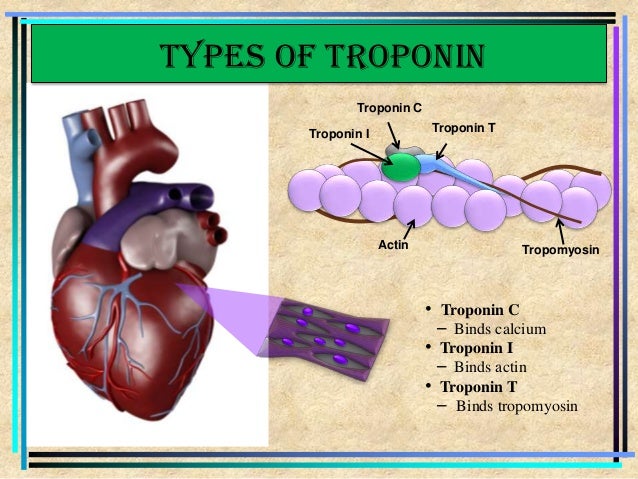
Troponin, a regulatory protein complex essential for cardiac muscle contraction, serves as the gold standard biomarker for diagnosing myocardial injury. Its release into circulation following myocardial cell damage provides critical diagnostic and prognostic information in acute coronary syndromes (ACS). High-sensitivity troponin assays (hs-Tn) have revolutionized early detection by lowering the limit of detection and improving temporal resolution, enabling clinicians to identify myocardial infarction (MI) within hours of symptom onset. This section examines the physiological role of troponin isoforms (TnI and TnT), compares diagnostic thresholds across major guidelines, and evaluates the clinical utility of hs-Tn assays in risk stratification.The cardiac troponin complex consists of three subunits: troponin C (TnC), troponin I (TnI), and troponin T (TnT). TnI and TnT are cardiac-specific isoforms, with TnT also present in skeletal muscle but distinguishable via structural differences. Upon myocardial necrosis, troponin is released into the bloodstream in a biphasic pattern: an initial rapid rise within 3–6 hours, peaking at 12–48 hours, followed by a gradual decline over 7–10 days. This temporal profile underpins the necessity of serial measurements in ACS evaluation.
Physiological Role and Release Kinetics of Troponin in Myocardial Injury
The structural integrity of cardiac troponin is disrupted during myocardial ischemia, leading to its passive leakage into the extracellular space. Key mechanisms include:The time-to-peak release varies by assay type and injury severity:
Diagnostic Thresholds for Troponin in Acute Myocardial Infarction: Comparative Analysis of Guidelines
The following table summarizes troponin thresholds for MI diagnosis according to major cardiovascular societies, incorporating assay-specific cutoffs, sensitivity, and clinical adjustments. Note: Values are assay-dependent; local laboratory reference ranges must be consulted.| Troponin Type | Guideline | Diagnostic Cutoff (ng/L or pg/mL) | Time to Peak Post-Injury | Sensitivity/Specificity Range | Clinical Context Notes |
|---|---|---|---|---|---|
| hs-TnT | ESC (2023) | <5 ng/L (99th percentile URL) | 3–12 hours (hs-Tn) | 90–95% sensitivity; 90% specificity | Adjust for renal impairment: >10 ng/L in CKD Stage 4–5 may require alternative diagnoses. |
| hs-TnI | ACC/AHA (2022) | <34 ng/L (99th percentile URL) | 3–6 hours (hs-Tn) | 85–90% sensitivity; 88% specificity | Serial measurements recommended if initial value is 34–100 ng/L ("grey zone"). |
| cTnI (conventional) | NICE (2016) | >0.04 µg/L (40 ng/L) | 12–24 hours | 70–80% sensitivity; 90% specificity | Less sensitive for early MI; not recommended for hs-Tn assays. |
| hs-TnT | American College of Cardiology (2020) | <6 ng/L (99th percentile URL) | 3–12 hours | 92% sensitivity; 87% specificity | Dynamic changes (>20% increase/decrease) required for diagnosis in "grey zone." |
High-Sensitivity Troponin Assays: Enhancing Early Detection of Myocardial Infarction
Conventional troponin assays have limited sensitivity for early MI detection due to their higher limits of detection (LoD). High-sensitivity troponin assays (hs-Tn) overcome this by:Step-by-Step Workflow for Interpreting Serial Troponin Trends:
1. Initial Presentation:
2. Grey Zone Management (e.g., 18–52 ng/L for hs-TnT):
3. Final Risk Stratification:
Case Study: Differential Diagnosis in the Troponin Grey Zone (18–52 ng/L hs-TnT)
Patient Presentation:Differential Diagnosis Decision Tree:
-
Step 1: Assess for Acute Myocardial Infarction (Type 1 MI)
- Supporting evidence:
- Dynamic troponin rise: Repeat hs-TnT at 3 hours = 35 ng/L (>20% increase).
- ECG evolution: New 1-mm ST depression in V4
- Acute MI: Troponin remains elevated for 7–14 days post-infarct, with troponin I detectable up to 10–14 days and troponin T for 5–7 days.
- Chronic MI: Persistent elevation (>14 days) suggests chronic myocardial injury, often seen in reperfusion injury, myocarditis, or recurrent ischemia. Differentiation from acute MI requires clinical correlation with ECG changes, echocardiographic wall motion abnormalities, and coronary angiography.
- STEMI demonstrates rapid, high-magnitude troponin rise due to transmural infarction, with ECG correlation (ST elevation/Q waves).
- NSTEMI shows slower, lower-peak elevations reflecting subendocardial damage, often with dynamic ST changes but no Q waves.
- Type 2 MI exhibits blunted or fluctuating troponin without acute ischemic ECG changes, requiring clinical context (e.g., supply-demand imbalance) for diagnosis.
- Faster troponin rise (due to larger infarct size) with higher peak levels (troponin I >15 ng/L).
- Early hemodynamic instability (e.g., cardi
-
Inflammatory/Infectious Conditions
-
Sepsis
- Condition Type: Systemic inflammatory response syndrome (SIRS) with myocardial depression.
- Typical Troponin Range: Mild to moderate elevation (0.05–1.0 ng/mL), often transient.
- Key Differentiating Features:
- Elevated procalcitonin and lactate levels.
- Absence of new ECG changes (e.g., ST-segment elevation).
- Troponin peaks within 24–48 hours of sepsis onset, with gradual decline over 72 hours.
-
Myocarditis
- Condition Type: Viral or autoimmune-mediated myocardial inflammation.
- Typical Troponin Range: Moderate to marked elevation (0.1–10 ng/mL), often sustained.
- Key Differentiating Features:
- Elevated C-reactive protein (CRP > 10 mg/L) and brain natriuretic peptide (BNP > 400 pg/mL).
- New ECG abnormalities (e.g., AV block, diffuse ST-T changes) and echocardiographic findings (e.g., wall motion abnormalities, pericardial effusion).
- Troponin elevation may precede symptoms by days; cardiac MRI often confirms edema/inflammation.
-
Takotsubo Cardiomyopathy (Stress-Induced)
- Condition Type: Apical ballooning syndrome triggered by emotional/physical stress.
- Typical Troponin Range: Marked elevation (0.5–20 ng/mL), similar to STEMI.
- Key Differentiating Features:
- Characteristic echocardiographic appearance (apical akinesis with basal hyperkinesis).
- Absence of obstructive coronary artery disease on angiography.
- Troponin peaks at 24–48 hours, with resolution over 7–14 days; BNP often elevated (>1,000 pg/mL).
-
Sepsis
-
Ischemic/Non-Coronary Conditions
-
Pulmonary Embolism (PE)
- Condition Type: Right ventricular (RV) strain due to increased afterload.
- Typical Troponin Range: Mild to moderate elevation (0.05–0.5 ng/mL), often transient.
- Key Differentiating Features:
- Elevated D-dimer (>500 ng/mL) and BNP (>300 pg/mL) in RV strain.
- ECG findings: Sinus tachycardia, incomplete RBBB, or new Q waves in V1–V4 (S1Q3T3 pattern).
- Troponin peaks at 6–12 hours, normalizes within 72 hours if no MI.
-
Heart Failure (Acute Decompensated)
- Condition Type: Increased wall stress and hypoxia in non-infarcted myocardium.
- Typical Troponin Range: Mild elevation (0.05–0.3 ng/mL), often persistent.
- Key Differentiating Features:
- Elevated BNP (>1,000 pg/mL) and NT-proBNP (>3,000 pg/mL).
- Echocardiographic evidence of reduced ejection fraction (EF <40%) or diastolic dysfunction.
- Troponin elevation correlates with severity of HF; no dynamic rise/fall pattern.
-
Pulmonary Embolism (PE)
-
Toxic/Metabolic Causes
-
Renal Disease (Acute/Chronic)
- Condition Type: Reduced troponin clearance and uremic cardiomyopathy.
- Typical Troponin Range: Mild elevation (0.03–0.2 ng/mL), often stable.
- Key Differentiating Features:
- Elevated creatinine (>1.5 mg/dL) and troponin levels correlate with GFR decline.
- Absence of dynamic changes; ECG may show uremic changes (e.g., prolonged QT).
- CK-MB and myoglobin levels remain normal.
-
Critical Illness/Polyorgan Dysfunction
- Condition Type: Systemic inflammation, hypoxia, and catecholamine excess.
- Typical Troponin Range: Variable (0.05–5 ng/mL), often sustained.
- Key Differentiating Features:
- Elevated lactate (>2 mmol/L) and SOFA score >6.
- Troponin elevation correlates with illness severity (e.g., sepsis, ARDS, shock).
- CK-MB and myoglobin may be normal or mildly elevated.
-
Toxic Exposures (e.g., Chemotherapy, Cocaine)
- Condition Type: Direct myocardial toxicity or vasospasm.
- Typical Troponin Range: Moderate to marked elevation (0.1–10 ng/mL), often transient.
- Key Differentiating Features:
- History of exposure (e.g., anthracyclines, cocaine).
- ECG changes: ST-segment elevation (cocaine) or non-specific T-wave inversions (chemotherapy).
- Troponin peaks within 6–24 hours, resolves over 3–5 days.
-
Renal Disease (Acute/Chronic)
-
Procedural/Traumatic Causes
-
Post-Percutaneous Coronary Intervention (PCI) Elevation
The interpretation of troponin levels in the context of suspected myocardial infarction demands a nuanced approach that balances assay sensitivity, temporal kinetics, and clinical context. High-sensitivity troponin assays have expanded diagnostic horizons by revealing subtle elevations in non-ST-elevation MI and type 2 MI, yet their utility is maximized when paired with dynamic trends and adjunct biomarkers. False-positive elevations from sepsis, heart failure, or renal impairment underscore the necessity of a differential diagnostic framework, while regional wall motion abnormalities and infarct subtypes further refine risk stratification. By synthesizing guideline-recommended thresholds, kinetic profiles, and case-specific adjustments, clinicians can navigate diagnostic ambiguity with greater precision—ultimately improving patient outcomes through timely and accurate identification of acute coronary syndromes. This analysis serves as a pragmatic guide for translating troponin data into actionable clinical decisions, reinforcing the biomarker’s indispensable role in modern cardiology.
FAQ
What troponin level is considered indicative of a heart attack in Australia?
In Australia, a troponin level above the 99th percentile URL (upper reference limit) is typically considered abnormal. For high-sensitivity troponin T (hs-TnT), this is usually >14 ng/L, while for troponin I (hs-TnI), it’s often >50 ng/L. Rising or falling levels over time are key for diagnosing a heart attack.
What troponin level suggests a heart attack in the UK?
In the UK, a troponin level above the 99th percentile URL is used, with thresholds varying by assay. For high-sensitivity troponin T (hs-TnT), >14 ng/L is often critical, while for troponin I (hs-TnI), >34 ng/L may indicate myocardial injury. Clinical context and trends are essential for diagnosis.
What troponin levels are used to diagnose a heart attack in Canada?
Canadian guidelines follow the 99th percentile URL cutoff, typically >52 ng/L for troponin I and >14 ng/L for troponin T in high-sensitivity assays. A single elevated level may suggest injury, but a rise or fall of ≥20% over 3–6 hours is stronger evidence of acute myocardial infarction.
What troponin level in pg/mL indicates a heart attack?
Troponin levels are usually reported in ng/L, not pg/mL, but conversion is 1 ng/L = 1,000 pg/L. For high-sensitivity troponin T, >14,000 pg/L (or >14 ng/L) is often the threshold. For troponin I, >50 ng/L (~50,000 pg/L) may indicate damage, but exact values depend on the lab’s assay.
What troponin level in ng/L indicates a heart attack?
A troponin level above the 99th percentile URL—typically ≥14 ng/L for troponin T (hs-TnT) or ≥34–50 ng/L for troponin I (hs-TnI)—suggests myocardial injury. However, a rise or fall of ≥20% within hours is more specific for acute heart attack diagnosis.
What troponin levels do people on Reddit say indicate a heart attack?
On Reddit, many users cite troponin T >14 ng/L or troponin I >34–50 ng/L as red flags, but they emphasize that trends over time (e.g., doubling in 3–6 hours) are more reliable than a single value. Some warn that false positives (e.g., kidney disease) can occur, and clinical correlation is critical. Always consult a doctor for accurate interpretation.
-
Post-Percutaneous Coronary Intervention (PCI) Elevation

Dynamic Changes in Troponin: Patterns and Timing for Heart Attack Confirmation
The kinetic profile of troponin release following myocardial infarction (MI) is a critical diagnostic tool, enabling clinicians to distinguish acute coronary syndromes (ACS) based on temporal patterns of elevation. Troponin I and T exhibit distinct release dynamics post-ischemia, influenced by infarct size, myocardial perfusion, and regional wall motion abnormalities. Understanding these patterns—including the initial rise, peak concentration, half-life, and duration of elevation—facilitates early diagnosis, risk stratification, and therapeutic decision-making. Below, the temporal behavior of troponin is dissected across ACS subtypes, with emphasis on how regional myocardial damage modulates release kinetics.
Kinetic Profile of Troponin Release Post-MI
The release of troponin into circulation following MI follows a predictable, biphasic pattern characterized by an initial rise, peak, and gradual decline. This profile is influenced by myocardial necrosis extent, reperfusion status, and collateral blood flow. Key phases include:- Initial Rise Time: Troponin I begins rising within 2–4 hours post-symptom onset, with detectable elevations in 4–6 hours for troponin T. The delay reflects the time required for cellular injury to disrupt sarcolemmal integrity and release cytosolic troponin into the interstitial space. Early elevations (<6 hours) are more pronounced in STEMI due to full-thickness infarction, whereas NSTEMI may show delayed or modest rises due to subendocardial involvement.
- Peak Concentration Window: Troponin I peaks at 12–24 hours post-MI, while troponin T reaches its maximum at 10–14 hours. The peak level correlates with infarct size, with STEMI often exceeding 10–20 ng/L (troponin I) or >1.5 ng/mL (troponin T), whereas NSTEMI typically peaks below these thresholds. Type 2 MI (supply-demand mismatch) may exhibit blunted peaks due to intermittent ischemia rather than sustained necrosis.
- Half-Life and Clearance Rate: Troponin I has a half-life of ~7–10 days, while troponin T clears more rapidly (~2–3 days). Clearance is primarily renal, with delayed elimination in patients with chronic kidney disease (CKD) or heart failure, prolonging elevation beyond 7–10 days. Reperfusion therapy (e.g., PCI or thrombolysis) may accelerate troponin clearance by limiting infarct expansion.
- Duration of Elevation:
Troponin Trends Across ACS Subtypes: Comparative Analysis
The following table summarizes troponin dynamics in STEMI, NSTEMI, and Type 2 MI, integrating temporal patterns with ECG and clinical findings. Data reflect median values from large-scale studies (e.g., FRISC, TIMI, GRACE).
Key Observations:Time Post-Onset Troponin Level (ng/L) ECG Findings Clinical Presentation STEMI 0–2 hours Baseline or slight rise (<0.05 ng/L) ST elevation ≥1 mm in ≥2 contiguous leads Chest pain, diaphoresis, nausea, dyspnea 4–6 hours 0.1–1.0 ng/L (troponin I) Persistent ST elevation, Q waves developing Peak pain, possible hemodynamic instability 12–24 hours 10–20 ng/L (troponin I) or >1.5 ng/mL (troponin T) Pathologic Q waves, T-wave inversion Resolving pain, possible heart failure signs 72+ hours Gradual decline (troponin I > troponin T) Persistent Q waves, late T-wave changes Stable but possible arrhythmias NSTEMI 0–6 hours 0.05–0.5 ng/L (troponin I) ST depression/T-wave inversion, no Q waves Atypical chest pain, dyspnea, or asymptomatic 12–24 hours 1–5 ng/L (troponin I) or 0.5–1.0 ng/mL (troponin T) Dynamic ST changes, possible new Q waves Recurrent ischemia, heart failure symptoms 48–72 hours Peak then gradual decline Persistent ST/T changes Stable but high-risk for recurrent events 7–10 days Return toward baseline (if no reinfarction) Resolving ST changes Monitor for complications (e.g., VSD, heart failure) Type 2 MI 0–4 hours Minimal rise (<0.1 ng/L) or fluctuating Non-specific ST/T changes, no new Q waves Hypotension, tachycardia, or dyspnea (trigger: sepsis, arrhythmia, anemia) 12–24 hours 0.2–1.0 ng/L (troponin I), often <99th percentile No acute ischemic changes Persistent hemodynamic stress 48+ hours Fluctuating or stable elevation No ECG evolution Resolution with trigger management 7–14 days Normalization if trigger resolved Baseline ECG No evidence of new necrosis
Regional Wall Motion Abnormalities and Troponin Release Patterns
The anatomical location of infarction influences troponin kinetics due to variations in myocardial mass, collateral perfusion, and ventricular mechanics. Below are the key differences:- Anterior MI (LAD occlusion):
False Positives and Negatives: Troponin Elevations Beyond Acute Myocardial Infarction
Troponin elevations are highly specific for myocardial injury but are not exclusive to acute coronary syndromes (ACS). Non-ischemic conditions, critical illnesses, and procedural interventions frequently elevate troponin levels through distinct pathophysiological mechanisms—ranging from myocardial necrosis to cytoplasmic leakage. Differentiating these etiologies requires integration of troponin kinetics, adjunct biomarkers, and clinical context. Misinterpretation of elevated troponin in non-cardiac settings may lead to unnecessary interventions, delayed diagnoses, or missed opportunities for targeted therapy. This section categorizes non-ACS causes of troponin elevation, outlines diagnostic protocols for distinguishing myocardial necrosis from cytoplasmic release, and describes characteristic troponin patterns in specific syndromes.
Categorized Non-Cardiac Causes of Troponin Elevation
Non-ACS conditions that elevate troponin levels can be grouped by underlying pathophysiology: inflammatory, ischemic (non-coronary), toxic/metabolic, or hemodynamic stress. Each category exhibits unique troponin kinetics, biomarker profiles, and clinical features that aid differentiation from myocardial infarction (MI). Below is a structured overview of these conditions, including typical troponin ranges and key differentiating markers.
- Supporting evidence:
Leave a Comment
Comments are moderated before appearing. The data you submit is processed according to the Privacy Policy of Voltefac.