What Currency Is Worth The Most Exploring Global Value Hierarchies
Table of Contents
- Historical Context of the Most Valuable Currencies
- Evolution of Currency Dominance: Gold Standards to Fiat Systems
- Decade-by-Decade Ranking of Top 5 Most Valuable Currencies (1950–2020)
- Hyperinflation and Currency Demotion: Case Studies of Zimbabwe and Venezuela
- Factors Determining Currency Value: Economic and Political Levers
- Macroeconomic Indicators and Currency Strength
- Political Stability and Central Bank Policies
- Purchasing Power Parity and the Big Mac Index
- Commodity-Linked vs. Non-Com Regional Powerhouses: Currencies Dominating Specific Markets Currency dominance in global trade and finance is not solely determined by economic size or population; regional powerhouses emerge through strategic trade flows, energy exports, and financial ecosystems that anchor their currencies as de facto reserves in their respective markets. While the U.S. dollar and euro command global liquidity, certain currencies achieve outsized value within their regions due to specialized economic roles—whether as trade intermediaries, energy-backed assets, or remittance hubs. Understanding these dynamics reveals how currencies like the Kuwaiti Dinar or Singapore Dollar maintain purchasing power far exceeding their nominal exchange rates, often defying conventional GDP-based valuation metrics. The following analysis examines the top three most valuable currencies in four major regions—Asia, the Middle East, Africa, and Latin America—highlighting their trade drivers, central bank governance, and geopolitical leverage. Additionally, a methodology for ranking currencies by real-world purchasing power (beyond exchange rates) is outlined, followed by a comparative table of key metrics. The discussion concludes with an exploration of offshore currencies, which sustain high valuations through pegging mechanisms despite limited domestic economic activity. Top Valuable Currencies by Region and Their Trade Anchors
- Top 3 Most Valuable Currencies by Region
- Asia
- Digital and Alternative Currencies: Challenging Traditional Value
- Mechanics of Stablecoins and Their Interaction with Fiat Currencies
- Factors Propelling Cryptocurrencies to Surpass Traditional Currencies in Value
- Pathway for a Central Bank Digital Currency (CBDC) to Become the Most Valuable Digital Asset
- FAQ
- Which currency is currently the most valuable in the world?
- Which currency has the highest value when converted to US dollars?
- What is the most valuable currency in the world right now?
- Which currency is worth the most money in terms of purchasing power?
- Which currency is worth the most compared to the US dollar?
- What is the most valuable currency in the world today?
The question of which currency holds the greatest value transcends mere exchange rates, delving into centuries of economic evolution, geopolitical strategy, and technological disruption. From the gold-backed stability of the 19th century to today’s algorithm-driven digital assets, currency dominance has been repeatedly reshaped by crises, innovation, and shifting global power dynamics. The Swiss Franc’s resilience amid crises, the USD’s unassailable reserve status, and the Kuwaiti Dinar’s unmatched purchasing power per unit all underscore how value is not merely a function of numbers but of trust, policy foresight, and real-world utility. Understanding these forces reveals why some currencies command premiums while others falter—offering critical insights for investors, policymakers, and businesses navigating an increasingly interconnected financial landscape.
Historical shifts, such as the Bretton Woods Agreement’s collapse in 1971 and the Eurozone’s debt crises, have repeatedly redefined monetary hierarchies, often exposing the fragility of fiat systems when tested by inflation or political instability. Meanwhile, emerging digital currencies—from stablecoins pegged to the USD to decentralized assets like Bitcoin—pose a fundamental challenge to traditional notions of value. This exploration dissects the economic, political, and technological levers that elevate currencies to global prominence, while also examining the regional powerhouses and alternative assets that may redefine financial sovereignty in the decades ahead.
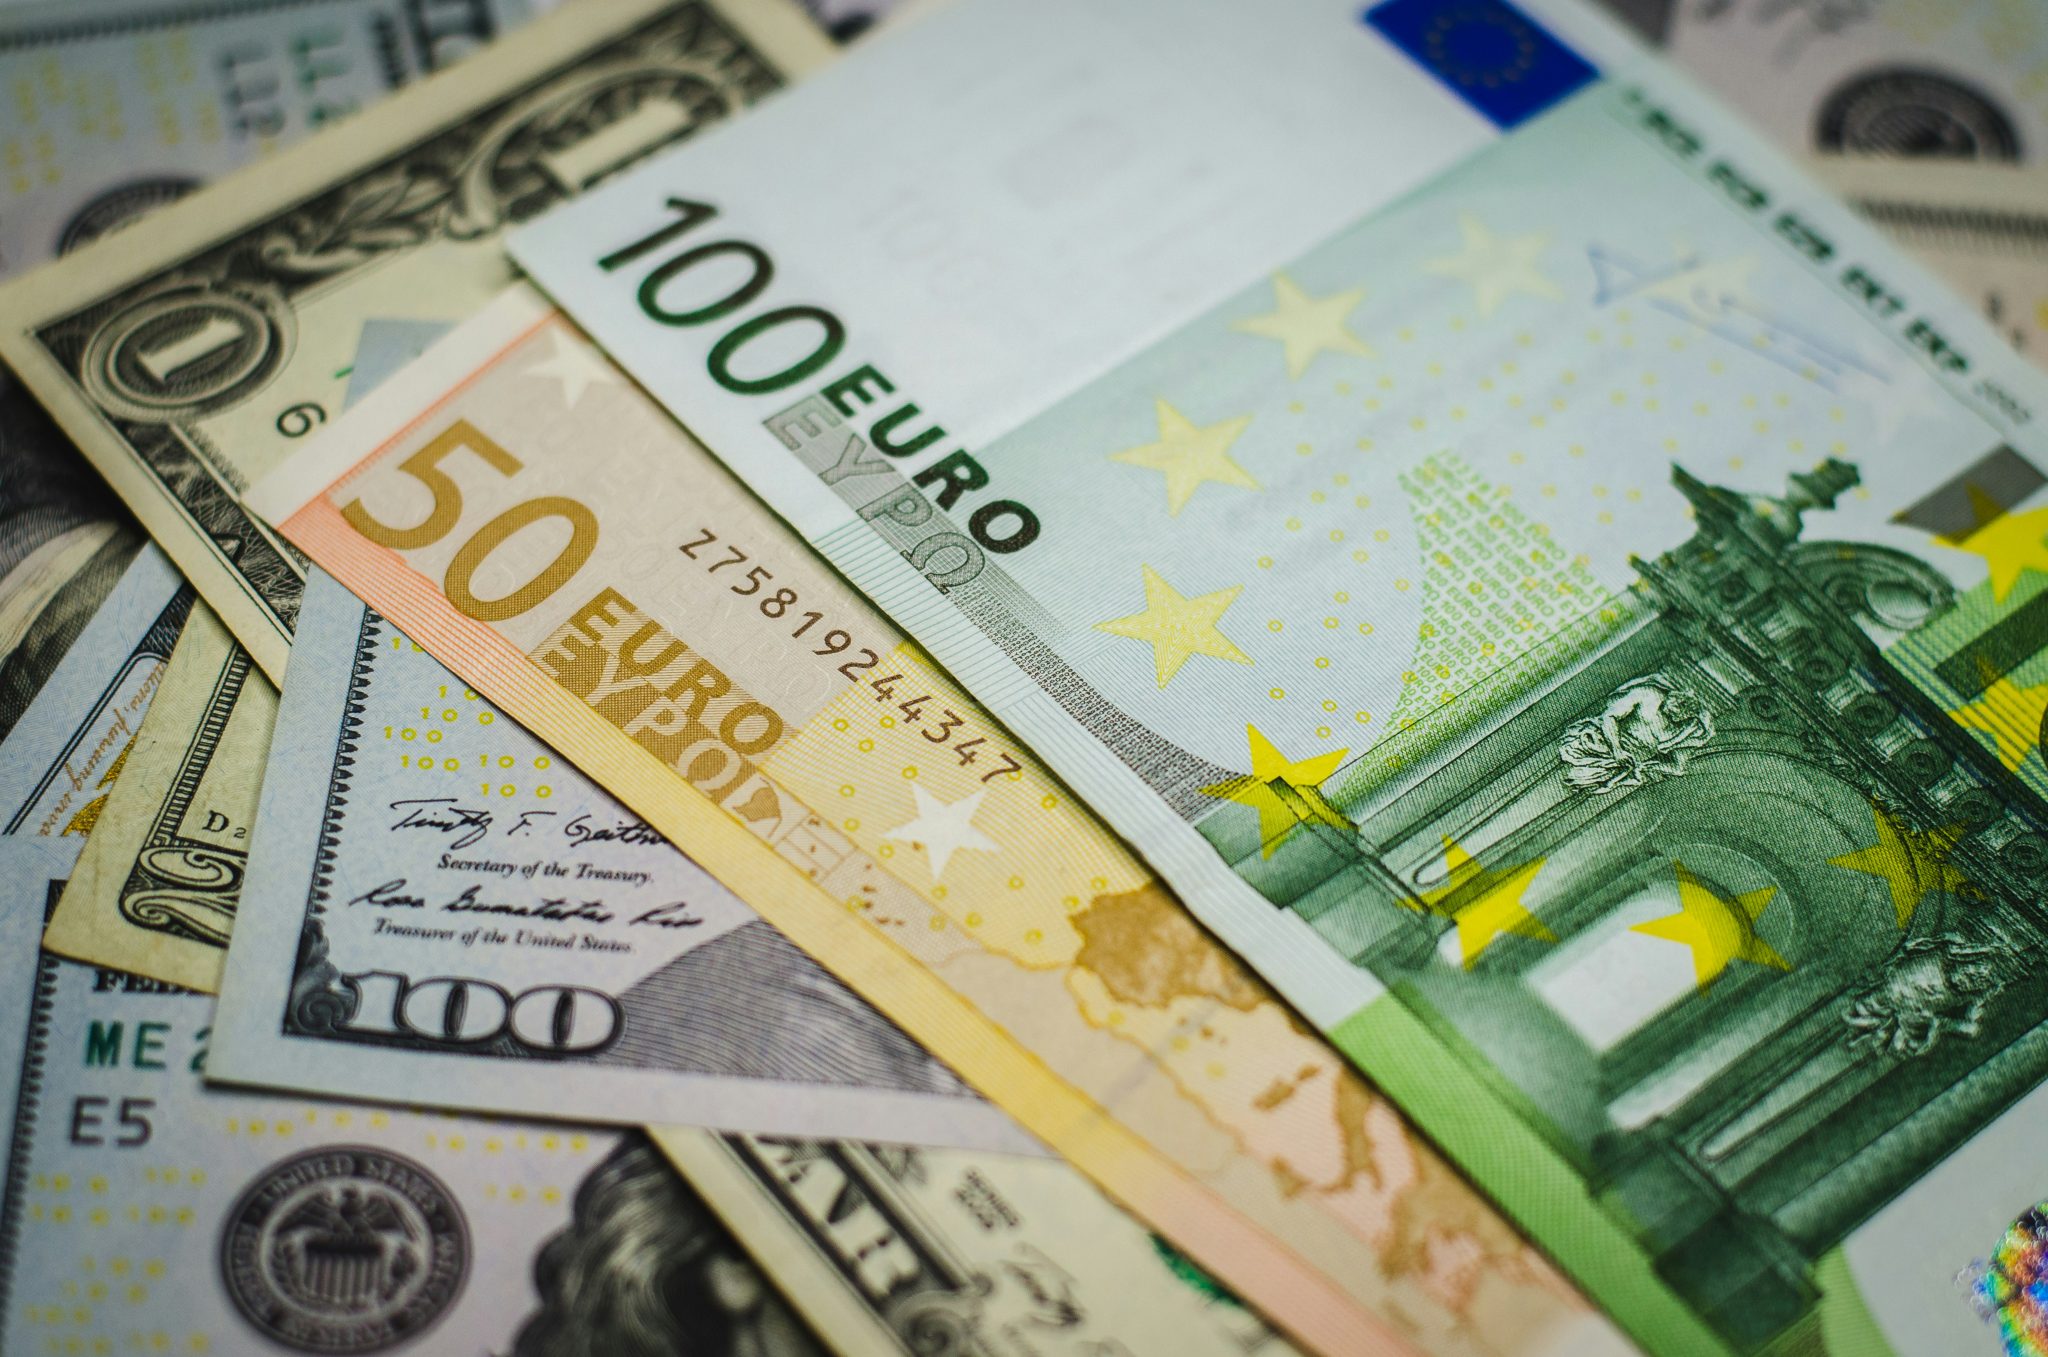
Historical Context of the Most Valuable Currencies
The dominance of global currencies has evolved significantly over the past century, transitioning from gold-backed systems to fiat currencies underpinned by geopolitical and monetary policy stability. Key milestones—such as the Bretton Woods Agreement (1944), the Nixon Shock (1971), and the Euro’s introduction (1999)—reshaped currency hierarchies by dismantling fixed exchange rates and introducing floating systems. These shifts reflected broader economic trends, including the decline of colonial empires, the rise of petrodollar systems, and the financialization of global trade. Understanding these transformations reveals how stability, trust, and institutional frameworks determine a currency’s long-term value.The most valuable currencies are not static; their rankings fluctuate based on economic resilience, central bank policies, and external shocks. While gold standards once anchored value, modern dominance hinges on factors like interest rate differentials, capital mobility, and sovereign debt credibility. Below, the evolution of the top 5 currencies per decade since 1950 is analyzed, alongside a comparative table illustrating their exchange rate dynamics against the U.S. dollar (USD) and pivotal economic events.
Evolution of Currency Dominance: Gold Standards to Fiat Systems
The gold standard (1870–1971) established currencies as convertible to gold, ensuring stability but limiting monetary flexibility. Post-World War II, the Bretton Woods system pegged major currencies to the USD, which was itself tied to gold at $35 per ounce. This arrangement collapsed in 1971 when President Nixon suspended gold convertibility, triggering the Nixon Shock and the shift to fiat currencies—money without intrinsic value but backed by government decree.The transition to fiat currencies introduced floating exchange rates, where value is determined by supply, demand, and market confidence. Key developments include:
"A currency’s strength is not merely a function of its exchange rate but of the perceived stability of the issuing economy’s institutions, debt levels, and geopolitical influence." — International Monetary Fund (IMF), 2020 Global Financial Stability Report
Decade-by-Decade Ranking of Top 5 Most Valuable Currencies (1950–2020)
The following table outlines the top 5 currencies by exchange rate strength (vs. USD) per decade, alongside defining economic events. Data sources include the IMF International Financial Statistics, World Bank, and Bank for International Settlements (BIS).| Currency | Year | Exchange Rate vs. USD (Highest in Decade) | Notable Economic Event |
|---|---|---|---|
| British Pound (GBP) | 1950s | $4.03 (1950) | Marshall Plan (1948): Post-war reconstruction boosted GBP’s trade role, though sterling’s decline began due to imperial debt. |
| Swiss Franc (CHF) | 1960s | $0.45 (1961) | Swiss National Bank (SNB) gold reserves: CHF’s stability stemmed from strict monetary policy and capital controls. |
| U.S. Dollar (USD) | 1970s | $1.00 (1971, pre-Nixon Shock) | Collapse of Bretton Woods (1971): USD devaluation led to floating rates, but its reserve currency status persisted. |
| Deutsche Mark (DEM) | 1980s | $0.50 (1985) | Plaza Accord (1985): DEM strengthened as the USD was deliberately weakened to reduce U.S. trade deficits. |
| Japanese Yen (JPY) | 1990s | ¥80 (1995) | Bubble Economy Collapse (1991): Yen’s strength reflected Japan’s export-led growth, though asset bubbles later destabilized it. |
| Euro (EUR) | 2000s | $1.60 (2008) | Global Financial Crisis (2008): EUR’s strength stemmed from the Eurozone’s collective reserves, though sovereign debt crises (e.g., Greece) tested its unity. |
| Swiss Franc (CHF) | 2010s | $1.20 (2015) | SNB’s EUR/CHF Peg Abandonment (2015): CHF surged due to safe-haven demand amid European debt fears. |
Hyperinflation and Currency Demotion: Case Studies of Zimbabwe and Venezuela
Hyperinflation erodes a currency’s value by exceeding 50% monthly inflation, rendering it unusable for trade. Two extreme cases—Zimbabwe (2000s) and Venezuela (2010s–present)—illustrate how economic mismanagement and political instability lead to currency collapse.Zimbabwean Dollar (ZWL)
Venezuelan Bolívar (VEF)
Contrast with Stable Curr

Factors Determining Currency Value: Economic and Political Levers
Currency valuation is fundamentally shaped by a complex interplay of macroeconomic fundamentals and geopolitical dynamics. While historical trends highlight the dominance of currencies like the U.S. dollar (USD), euro (EUR), and Japanese yen (JPY), their relative strength fluctuates in response to quantifiable economic indicators and less tangible political forces. These factors—ranging from inflation and interest rates to trade balances and central bank interventions—create a framework where currencies either appreciate or depreciate against peers. The interplay between these levers is best understood through case studies of major economies, where deviations from expected policies or external shocks trigger volatility. For instance, the Eurozone crisis demonstrated how fiscal discipline and monetary policy coordination could either stabilize or destabilize a currency bloc, while China’s managed yuan controls illustrate the tension between capital account liberalization and state-driven valuation adjustments.Macroeconomic Indicators and Currency Strength
The relationship between a currency’s value and key economic metrics is rooted in investor confidence, trade competitiveness, and monetary policy effectiveness. Three primary indicators—inflation rate, interest rates, and GDP growth—serve as leading predictors of currency movements, though their impact varies by economic context.Inflation Rate and Purchasing Power
Inflation erodes a currency’s purchasing power over time, prompting central banks to adjust monetary policy to curb depreciation. For example, the USD’s strength during the 1980s was partly attributed to the Federal Reserve’s aggressive tightening under Paul Volcker, which slashed inflation from 13.5% (1980) to 3.2% (1988). Conversely, the EUR weakened during the Eurozone crisis (2010–2012) as peripheral nations like Greece and Italy faced hyperinflationary risks, forcing the European Central Bank (ECB) to implement unconventional measures like Outright Monetary Transactions (OMTs) to stabilize bond markets. A persistent inflation differential—such as Japan’s decades-long deflationary environment—can lead to a carry trade phenomenon, where investors borrow in low-yielding JPY to invest in higher-yielding assets elsewhere, indirectly weakening the yen.
Interest Rates and Capital Flows
Interest rates are a direct tool for central banks to influence currency demand. Higher rates attract foreign capital seeking yield, increasing demand for the currency and appreciating its value. The USD benefited from this dynamic in 2018 when the Federal Reserve raised rates to 2.5% (from near-zero post-2008), while the EUR and JPY faced pressure as the ECB and Bank of Japan maintained negative or ultra-low rates to stimulate growth. However, aggressive rate hikes can backfire if they stifle economic activity, as seen with the Swiss Franc (CHF) in 2015, where the Swiss National Bank (SNB) abruptly removed its EUR/CHF peg, causing a 30% spike in the franc’s value and disrupting export-dependent industries.
GDP Growth and Trade Competitiveness
A currency’s strength is closely tied to its economy’s growth trajectory, as robust GDP expansion signals future earning potential. The USD’s resilience during the 2020–2021 recovery was underpinned by a 6.9% GDP growth rate (2021), outpacing peers like the EUR (5.4%) and JPY (1.6%). Conversely, stagnant growth—such as Japan’s 1% average annual GDP growth since the 1990s—has contributed to the yen’s chronic weakness, as investors prioritize higher-yielding assets. Trade surpluses further bolster currency value by increasing foreign demand for domestic currency to pay for exports. China’s yuan (CNY) has appreciated against the USD since 2015 due to its consistent trade surplus (e.g., $676 billion in 2022), though capital controls limit its full market-driven valuation. In contrast, commodity-dependent currencies like the Canadian Dollar (CAD) and Australian Dollar (AUD) derive strength from global demand for oil and minerals, as seen during the 2022 energy crisis when CAD surged 10% against the USD amid rising crude prices.
Political Stability and Central Bank Policies
While economic fundamentals provide a baseline for currency valuation, political stability and central bank autonomy act as accelerants or brakes. Instability—whether through fiscal mismanagement, geopolitical tensions, or policy reversals—can trigger sudden depreciations, as demonstrated by the Argentine peso’s collapse (2018–2020) or the Turkish lira’s volatility under Erdogan’s presidency. Conversely, credible monetary institutions and coordinated fiscal policies can shield currencies from speculative attacks, as seen with the ECB’s response to the Eurozone crisis.Trade Surpluses and Capital Account Liberalization
A persistent trade surplus enhances currency demand, but its sustainability depends on capital account policies. China’s yuan has appreciated gradually since 2015 due to its $877 billion trade surplus (2023), yet its valuation remains influenced by the People’s Bank of China (PBOC), which intervenes to prevent rapid appreciation to protect exporters. In contrast, the USD’s dominance stems from the U.S. current account deficit being offset by its status as the world’s reserve currency—a role reinforced by the petrodollar system, where oil exporters hold USD reserves. The Eurozone’s struggle with trade imbalances (e.g., Germany’s surplus vs. Italy’s deficit) has led to internal tensions, underscoring how political fragmentation can undermine currency cohesion.
Central Bank Interventions and Unconventional Measures
Central banks employ a range of tools to influence currency values, from foreign exchange interventions to quantitative easing (QE). The ECB’s QE program (2015–2022), which purchased €2.6 trillion in assets, weakened the EUR by flooding markets with liquidity but stabilized peripheral bond markets. Japan’s Abenomics (2012–2020) combined aggressive QE with fiscal stimulus to combat deflation, though the JPY’s weakness persisted due to global low-rate environments. The Swiss Franc’s 2015 intervention serves as a cautionary tale: the SNB’s attempt to cap the franc’s appreciation failed in the long term, as structural factors (e.g., safe-haven demand) continued to drive its strength.
Geopolitical Risks and Sanctions
Political risks can override economic fundamentals. The Russian ruble’s 30% depreciation (2022) following Western sanctions demonstrated how geopolitical isolation can trigger currency collapses despite Russia’s commodity wealth. Similarly, the Iranian rial’s devaluation (from 42,000 to 500,000 per USD since 2018) reflects U.S. sanctions and capital flight. Even stable currencies like the USD face pressure during crises, as seen in 2020 when the USD strengthened 10% against the EUR due to its safe-haven status amid the COVID-19 pandemic.
Purchasing Power Parity and the Big Mac Index
The Big Mac Index, developed by The Economist in 1986, is a lighthearted yet insightful tool for assessing purchasing power parity (PPP)—the theory that exchange rates should adjust to equalize the cost of identical goods across countries. By comparing the price of a Big Mac in different currencies, the index reveals overvalued or undervalued currencies relative to PPP.The Big Mac Index calculates implied PPP exchange rates using the formula:While the index is simplistic—ignoring factors like labor costs, taxes, and local preferences—it aligns with broader PPP trends. Historical examples include:
Implied PPP = (Price of Big Mac in Country A / Price of Big Mac in Country B) × Exchange Rate
For example, if a Big Mac costs $5.50 in the U.S. and ¥450 in Japan (as of 2023), the implied PPP for USD/JPY would be:
(5.50 / 450) × 100 = 1.22, suggesting the yen is ~22% undervalued against the USD based on burger prices.
Critics argue the index oversimplifies PPP, but it serves as a quick sanity check for currency misalignments, particularly in emerging markets where official exchange rates diverge from market realities.
Commodity-Linked vs. Non-Com
Regional Powerhouses: Currencies Dominating Specific Markets
Currency dominance in global trade and finance is not solely determined by economic size or population; regional powerhouses emerge through strategic trade flows, energy exports, and financial ecosystems that anchor their currencies as de facto reserves in their respective markets. While the U.S. dollar and euro command global liquidity, certain currencies achieve outsized value within their regions due to specialized economic roles—whether as trade intermediaries, energy-backed assets, or remittance hubs. Understanding these dynamics reveals how currencies like the Kuwaiti Dinar or Singapore Dollar maintain purchasing power far exceeding their nominal exchange rates, often defying conventional GDP-based valuation metrics.The following analysis examines the top three most valuable currencies in four major regions—Asia, the Middle East, Africa, and Latin America—highlighting their trade drivers, central bank governance, and geopolitical leverage. Additionally, a methodology for ranking currencies by real-world purchasing power (beyond exchange rates) is outlined, followed by a comparative table of key metrics. The discussion concludes with an exploration of offshore currencies, which sustain high valuations through pegging mechanisms despite limited domestic economic activity.
Top Valuable Currencies by Region and Their Trade Anchors
Regional currencies derive their strength from specialized economic functions that create demand beyond domestic borders. In Asia, the Singapore Dollar (SGD) and Japanese Yen (JPY) dominate as trade finance hubs, while the Kuwaiti Dinar (KWD) and Bahraini Dinar (BHD) thrive on oil revenues and financial services. Africa’s South African Rand (ZAR) and Moroccan Dirham (MAD) reflect commodity exports and remittance inflows, whereas Latin America’s Brazilian Real (BRL) and Mexican Peso (MXN) are tied to agricultural and energy trade.Key patterns emerge:
Energy exporters (e.g., KWD, Saudi Riyal) maintain high value via oil-backed pegs or sovereign wealth funds.
Trade hubs (e.g., SGD, Hong Kong Dollar) benefit from financial intermediation and offshore banking.
Remittance-dependent economies (e.g., MAD, Mexican Peso) see currency stability tied to diaspora inflows.
Offshore currencies (e.g., BHD, Omani Rial) leverage regional financial centers without large domestic economies. The following sections identify the top three currencies in each region, their primary economic drivers, and the mechanisms sustaining their value.
Top 3 Most Valuable Currencies by Region
Definition of "Most Valuable":
A currency’s value is assessed by:
1. Exchange rate strength (vs. USD/EUR).
2. Real purchasing power (cost of living parity in major cities).
3. Regional liquidity (usage in trade settlements, reserves).
4. Central bank credibility (inflation control, FX reserves).
Asia
1. Kuwaiti Dinar (KWD)
Primary Driver: Oil exports (Kuwait ranks 15th globally in reserves, with ~95% of revenue from petroleum).
Trade Role: Used in Gulf Cooperation Council (GCC) trade; pegged to a basket of currencies (40% USD, 40% EUR, 10% JPY, 10% GBP) to diversify risk.
Purchasing Power: 1 KWD ≈ $3.25 (highest nominal value globally), but real purchasing power in Kuwait City is ~$1.80 due to subsidized utilities and housing. 2. Bahraini Dinar (BHD)
Primary Driver: Financial services (Bahrain hosts the GCC’s largest banking sector) and oil (though production is declining).
Trade Role: Pegged to USD (1 BHD = 0.376 USD); acts as a regional reserve currency for GCC governments.
Purchasing Power: Despite small GDP, Manama’s cost of living is ~20% lower than Dubai’s due to tax exemptions for expatriates. 3. Singapore Dollar (SGD)
Primary Driver: Trade finance (Singapore is the world’s 2nd-largest foreign exchange trading center after London).
Trade Role: Used in Asia-Pacific trade settlements; central bank (MAS) manages exchange rates via monetary policy bands.
Purchasing Power: 1 SGD ≈ $0.74, but real purchasing power in Singapore is ~$0.60 due to high housing costs (private condo prices exceed $1,500/sq ft). #### Middle East
1. Omani Rial (OMR)
Primary Driver: Oil exports (Oman has the 2nd-highest GDP per capita in the Arab world after Qatar).
Trade Role: Pegged to USD (1 OMR = 0.26 USD); used in GCC trade and Islamic finance.
Purchasing Power: Muscat’s cost of living is ~30% lower than Dubai’s, with no income tax for residents. 2. Jordanian Dinar (JOD)
Primary Driver: Remittances (over 30% of GDP from expatriate workers in Gulf states).
Trade Role: Pegged to USD (1 JOD = 0.29 USD); central bank (CBJ) intervenes to stabilize the currency amid fiscal deficits.
Purchasing Power: Amman’s cost of living is ~$0.25 per USD equivalent, but real wages are suppressed by high unemployment. 3. Qatari Rial (QAR)
Primary Driver: LNG exports (Qatar is the world’s largest LNG exporter).
Trade Role: Pegged to USD (1 QAR = 0.27 USD); used in Gulf infrastructure projects (e.g., FIFA World Cup 2022).
Purchasing Power: Doha’s cost of living is ~$0.23 per USD equivalent, but foreign workers (90% of the population) face rent burdens (average apartment: $1,200/month). #### Africa
1. South African Rand (ZAR)
Primary Driver: Commodity exports (gold, platinum, coal) and financial depth (Johannesburg is Africa’s largest stock exchange).
Trade Role: Used in Southern African Development Community (SADC) trade; central bank (SARB) targets inflation (3-6%).
Purchasing Power: 1 ZAR ≈ $0.057, but real purchasing power in Cape Town is ~$0.04 due to high inequality (Gini coefficient: 0.63). 2. Moroccan Dirham (MAD)
Primary Driver: Remittances (over 6% of GDP) and automotive exports (Renault, PSA).
Trade Role: Pegged to EUR (1 EUR = 11 MAD); used in Maghreb trade.
Purchasing Power: Casablanca’s cost of living is ~$0.08 per USD equivalent, with subsidized food (bread at $0.10/loaf). 3. Botswana Pula (BWP)
Primary Driver: Diamond exports (Debswana, a joint venture with De Beers, produces 20% of global diamonds).
Trade Role: Pegged to USD (1 BWP = $0.09); central bank (Bank of Botswana) maintains FX reserves at 30% of GDP.
Purchasing Power: Gaborone’s cost of living is ~$0.07 per USD equivalent, but inflation averages 3.5% due to import dependency. #### Latin America
1. Brazilian Real (BRL)
Primary Driver: Agricultural exports (soybeans, beef) and commodity futures trading (Brazil is the world’s largest exporter of coffee and sugar).
Trade Role: Used in Mercosur trade; central bank (BCB) employs interest rate adjustments to stabilize the currency.
Purchasing Power: 1 BRL ≈ $0.19, but São Paulo’s cost of living is ~$0.15 due to high service costs (restaurant meal: $10). 2. Mexican Peso (MXN)
Primary Driver: Remittances

Digital and Alternative Currencies: Challenging Traditional Value
The rise of digital and alternative currencies has redefined the global financial landscape, introducing decentralized, programmable, and often borderless assets that challenge the dominance of traditional fiat currencies. While stablecoins bridge the gap between cryptocurrencies and fiat by pegging value to stable assets, cryptocurrencies like Bitcoin and Ethereum leverage blockchain technology to reimagine monetary sovereignty, liquidity, and transactional efficiency. Central bank digital currencies (CBDCs) further complicate this dynamic by integrating digital innovation with state-backed monetary policy, potentially reshaping cross-border payments and financial inclusion. This section examines the mechanics of these currencies, their economic interactions, and the factors that could position them as the most valuable assets in the future.
Mechanics of Stablecoins and Their Interaction with Fiat Currencies
Stablecoins function as hybrid assets, combining the volatility resistance of traditional currencies with the efficiency of blockchain-based transactions. Their primary mechanism involves maintaining a 1:1 peg to a reserve asset, typically the U.S. dollar (e.g., USDT, USDC) or other fiat currencies, commodities (e.g., gold-backed stablecoins like PAXG), or algorithms (e.g., algorithmic stablecoins like UST, though now defunct post-collapse). The stability is enforced through collateralization—where reserves are held in regulated financial institutions—or overcollateralization, where the reserve value exceeds the circulating supply (e.g., MakerDAO’s DAI, backed by crypto assets).Stablecoins interact with fiat currencies in three critical ways:
1. Cross-Border Transactions: They reduce remittance costs and settlement times by leveraging blockchain’s decentralized infrastructure. For example, USDT facilitates remittances from the U.S. to the Philippines at near-instantaneous speeds and lower fees compared to traditional banking systems (e.g., Western Union or bank transfers), which often incur delays and currency conversion costs.
2. DeFi Ecosystems: Stablecoins serve as the backbone of decentralized finance (DeFi), enabling yield generation, lending, and borrowing without intermediaries. Platforms like Aave or Compound use stablecoins as collateral for loans, while protocols like Yearn Finance optimize liquidity provision. The total value locked (TVL) in DeFi often correlates with stablecoin dominance, with USDT and USDC accounting for over 60% of DeFi transaction volumes (Chainalysis, 2023).
3. Hedging and Arbitrage: Stablecoins allow traders to hedge against crypto volatility by converting assets to fiat-equivalent tokens during market downturns. Arbitrage opportunities arise when stablecoin prices deviate from their peg due to liquidity constraints, incentivizing market makers to restore equilibrium.
Key Stability Mechanisms:
Fiat-Backed: Reserves held in regulated banks (e.g., USDC by Circle and Coinbase Custody).
Crypto-Backed: Overcollateralized with other cryptocurrencies (e.g., DAI).
Algorithmic: Dynamic supply adjustments (e.g., Terra’s UST, now obsolete post-2022 collapse).
Factors Propelling Cryptocurrencies to Surpass Traditional Currencies in Value
For a cryptocurrency to surpass traditional currencies in value, it must address three core challenges: adoption, regulatory legitimacy, and technological scalability. The following factors outline the path to such dominance:
-
Adoption as a Medium of Exchange and Store of Value
- Institutional Adoption: Cryptocurrencies like Bitcoin are increasingly recognized as a digital gold—a hedge against inflation and currency devaluation. MicroStrategy’s $4.5 billion Bitcoin treasury and El Salvador’s legal tender status demonstrate growing institutional trust.
- Consumer and Merchant Adoption: Mass adoption requires seamless integration into daily transactions. Bitcoin’s Lightning Network and Ethereum’s Layer 2 solutions (e.g., Arbitrum, Optimism) aim to reduce transaction costs and latency, making crypto viable for microtransactions.
- Macroeconomic Conditions: Hyperinflation in countries like Venezuela or Argentina accelerates crypto adoption as a stable alternative. For example, Bitcoin’s market cap in Nigeria surged 300% in 2020 as the naira lost 30% of its value (Chainalysis, 2021).
-
Regulatory Clarity and Institutional Integration
- Legal Recognition: Countries like Switzerland (via the "Crypto Valley") and Singapore (via the Payment Services Act) provide regulatory sandboxes that foster innovation. The U.S. SEC’s evolving stance on Bitcoin ETFs (e.g., approval of spot Bitcoin ETFs in January 2024) signals growing institutional acceptance.
- Anti-Money Laundering (AML) and Know Your Customer (KYC) Compliance: Cryptocurrencies must integrate with global AML frameworks (e.g., FATF’s Travel Rule) to prevent illicit use while maintaining privacy. Projects like Privacy Pools (e.g., Tornado Cash) face scrutiny, highlighting the tension between regulation and decentralization.
- Central Bank and Sovereign Backing: A cryptocurrency backed by a major economy (e.g., a sovereign Bitcoin ETF or a CBDC hybrid) could bridge trust gaps. For instance, the Bahamas’ Sand Dollar (BSD) is a CBDC that operates alongside traditional currencies, offering a model for hybrid systems.
-
Technological Scalability and Security
- Blockchain Throughput: Bitcoin’s 7 transactions per second (TPS) and Ethereum’s 15-30 TPS (pre-L2 solutions) pale in comparison to Visa’s 24,000 TPS. Scalability solutions like Bitcoin’s Taproot upgrades and Ethereum’s sharding aim to address this, but real-world adoption remains limited.
- Energy Efficiency: Proof-of-Work (PoW) networks like Bitcoin face criticism for high energy consumption (~120 TWh annually, per the Cambridge Bitcoin Electricity Consumption Index). Transitioning to Proof-of-Stake (PoS) (as Ethereum did in 2022) reduces energy use by 99.95% while maintaining security.
- Interoperability: Cross-chain protocols (e.g., Polkadot, Cosmos) enable seamless asset transfers between blockchains, reducing fragmentation. For example, Wrapped Bitcoin (WBTC) allows Bitcoin to interact with Ethereum’s DeFi ecosystem.
Critical Mass Threshold:
A cryptocurrency must achieve critical mass in at least one of three domains—institutional adoption, retail usage, or regulatory endorsement—to surpass fiat in value. Bitcoin’s market cap ($1.2 trillion as of 2024) reflects its status as the closest contender, but scalability and adoption remain bottlenecks.
Pathway for a Central Bank Digital Currency (CBDC) to Become the Most Valuable Digital Asset
The evolution of a CBDC into the most valuable digital asset follows a structured, multi-stage process integrating pilot programs, monetary policy alignment, and global adoption. Below is a textual flowchart outlining the critical stages:1. Pilot Phase (Proof of Concept)
Objective: Test technical feasibility and public acceptance.
Examples:
Bahamas’ Sand Dollar (2020): First retail CBDC, used for daily transactions in a cash-light economy.
Sweden’s e-Krona (2021): Focused on reducing cash dependency amid declining physical currency use.
Key Metrics: Transaction volume, user adoption rate, and cost efficiency compared to traditional banking. 2. Regulatory and Legal Framework
Objective: Establish legal tender status and compliance with AML/KYC standards.
Components:
Central Bank Oversight: CBDCs must operate under existing monetary policy (e.g., the Federal Reserve’s digital dollar proposals).
Privacy Safeguards: Balancing transparency with user anonymity (e.g., China’s Digital Yuan uses a dual-layer system—personal and controlled accounts).
Interoperability Standards: Ensuring compatibility with existing payment rails (e.g., SWIFT for cross-border transactions). 3. Monetary Policy Integration
Objective: Embed CBDCs into inflation targeting, quantitative easing, and fiscal stimulus.
Mechanisms:
Programmable Money: CBDCs can enforce spending conditions (e.g., stimulus payments restricted to essential goods).
Negative Interest Rates: Central banks could apply negative yields to CBDC holdings to curb hoarding (as seen in Japan’s negative rates for traditional deposits).
Yield-Bearing CBDCs: Offering interest on deposits to incentivize usage (e.g., Jamaica’s pilot in 2023). 4. Cross-Border and Institutional Adoption
ObjectiveThe most valuable currencies are not merely reflections of economic strength but products of deliberate policy, cultural trust, and adaptive resilience in the face of disruption. Whether through the USD’s dominance as a reserve currency, the Kuwaiti Dinar’s unparalleled purchasing power, or the potential of stablecoins to streamline cross-border transactions, value is ultimately a construct of perception and utility. As digital currencies and central bank innovations continue to evolve, the question of what currency is worth the most may no longer hinge solely on historical prestige or commodity backing—but on agility, adoption, and the ability to embed itself into the fabric of global commerce. The future of currency value lies at the intersection of tradition and transformation, where stability meets innovation.
FAQ
Which currency is currently the most valuable in the world?
The Kuwaiti dinar (KWD) is the highest-valued currency in circulation, trading at around 3.25 USD per 1 KWD as of recent rates. The Bahraini dinar (BHD) and Omani rial (OMR) also rank among the strongest, with values near 2.65 and 2.60 USD respectively.
Which currency has the highest value when converted to US dollars?
The Kuwaiti dinar (KWD) holds the top spot, as 1 KWD equals roughly 3.25 USD. Other high-value currencies include the Bahraini dinar (1 BHD ≈ 2.65 USD) and the Omani rial (1 OMR ≈ 2.60 USD).
What is the most valuable currency in the world right now?
As of current exchange rates, the Kuwaiti dinar (KWD) remains the most valuable, followed closely by the Bahraini dinar (BHD) and the Omani rial (OMR). Rates fluctuate daily, but these currencies consistently lead.
Which currency is worth the most money in terms of purchasing power?
The Kuwaiti dinar (KWD) and Bahraini dinar (BHD) rank highest in purchasing power due to their high USD value and strong economies. However, currencies like the Swiss franc (CHF) or U.S. dollar (USD) may offer better global purchasing power in practice.
Which currency is worth the most compared to the US dollar?
The Kuwaiti dinar (KWD) is the strongest, with 1 KWD equaling about 3.25 USD. The Bahraini dinar (BHD) and Omani rial (OMR) also outperform the USD, with ratios around 2.65:1 and 2.60:1 respectively.
What is the most valuable currency in the world today?
Today, the Kuwaiti dinar (KWD) is still the highest-valued currency, followed by the Bahraini dinar (BHD) and Omani rial (OMR). These Gulf currencies maintain their dominance due to oil wealth and pegged exchange rates.
Regional Powerhouses: Currencies Dominating Specific Markets
Currency dominance in global trade and finance is not solely determined by economic size or population; regional powerhouses emerge through strategic trade flows, energy exports, and financial ecosystems that anchor their currencies as de facto reserves in their respective markets. While the U.S. dollar and euro command global liquidity, certain currencies achieve outsized value within their regions due to specialized economic roles—whether as trade intermediaries, energy-backed assets, or remittance hubs. Understanding these dynamics reveals how currencies like the Kuwaiti Dinar or Singapore Dollar maintain purchasing power far exceeding their nominal exchange rates, often defying conventional GDP-based valuation metrics.The following analysis examines the top three most valuable currencies in four major regions—Asia, the Middle East, Africa, and Latin America—highlighting their trade drivers, central bank governance, and geopolitical leverage. Additionally, a methodology for ranking currencies by real-world purchasing power (beyond exchange rates) is outlined, followed by a comparative table of key metrics. The discussion concludes with an exploration of offshore currencies, which sustain high valuations through pegging mechanisms despite limited domestic economic activity.
Top Valuable Currencies by Region and Their Trade Anchors
Regional currencies derive their strength from specialized economic functions that create demand beyond domestic borders. In Asia, the Singapore Dollar (SGD) and Japanese Yen (JPY) dominate as trade finance hubs, while the Kuwaiti Dinar (KWD) and Bahraini Dinar (BHD) thrive on oil revenues and financial services. Africa’s South African Rand (ZAR) and Moroccan Dirham (MAD) reflect commodity exports and remittance inflows, whereas Latin America’s Brazilian Real (BRL) and Mexican Peso (MXN) are tied to agricultural and energy trade.Key patterns emerge:
The following sections identify the top three currencies in each region, their primary economic drivers, and the mechanisms sustaining their value.
Top 3 Most Valuable Currencies by Region
Definition of "Most Valuable":
A currency’s value is assessed by:
1. Exchange rate strength (vs. USD/EUR).
2. Real purchasing power (cost of living parity in major cities).
3. Regional liquidity (usage in trade settlements, reserves).
4. Central bank credibility (inflation control, FX reserves).
Asia
1. Kuwaiti Dinar (KWD)2. Bahraini Dinar (BHD)
3. Singapore Dollar (SGD)
#### Middle East
1. Omani Rial (OMR)
2. Jordanian Dinar (JOD)
3. Qatari Rial (QAR)
#### Africa
1. South African Rand (ZAR)
2. Moroccan Dirham (MAD)
3. Botswana Pula (BWP)
#### Latin America
1. Brazilian Real (BRL)
2. Mexican Peso (MXN)
Digital and Alternative Currencies: Challenging Traditional Value
The rise of digital and alternative currencies has redefined the global financial landscape, introducing decentralized, programmable, and often borderless assets that challenge the dominance of traditional fiat currencies. While stablecoins bridge the gap between cryptocurrencies and fiat by pegging value to stable assets, cryptocurrencies like Bitcoin and Ethereum leverage blockchain technology to reimagine monetary sovereignty, liquidity, and transactional efficiency. Central bank digital currencies (CBDCs) further complicate this dynamic by integrating digital innovation with state-backed monetary policy, potentially reshaping cross-border payments and financial inclusion. This section examines the mechanics of these currencies, their economic interactions, and the factors that could position them as the most valuable assets in the future.Mechanics of Stablecoins and Their Interaction with Fiat Currencies
Stablecoins function as hybrid assets, combining the volatility resistance of traditional currencies with the efficiency of blockchain-based transactions. Their primary mechanism involves maintaining a 1:1 peg to a reserve asset, typically the U.S. dollar (e.g., USDT, USDC) or other fiat currencies, commodities (e.g., gold-backed stablecoins like PAXG), or algorithms (e.g., algorithmic stablecoins like UST, though now defunct post-collapse). The stability is enforced through collateralization—where reserves are held in regulated financial institutions—or overcollateralization, where the reserve value exceeds the circulating supply (e.g., MakerDAO’s DAI, backed by crypto assets).Stablecoins interact with fiat currencies in three critical ways:
1. Cross-Border Transactions: They reduce remittance costs and settlement times by leveraging blockchain’s decentralized infrastructure. For example, USDT facilitates remittances from the U.S. to the Philippines at near-instantaneous speeds and lower fees compared to traditional banking systems (e.g., Western Union or bank transfers), which often incur delays and currency conversion costs.
2. DeFi Ecosystems: Stablecoins serve as the backbone of decentralized finance (DeFi), enabling yield generation, lending, and borrowing without intermediaries. Platforms like Aave or Compound use stablecoins as collateral for loans, while protocols like Yearn Finance optimize liquidity provision. The total value locked (TVL) in DeFi often correlates with stablecoin dominance, with USDT and USDC accounting for over 60% of DeFi transaction volumes (Chainalysis, 2023).
3. Hedging and Arbitrage: Stablecoins allow traders to hedge against crypto volatility by converting assets to fiat-equivalent tokens during market downturns. Arbitrage opportunities arise when stablecoin prices deviate from their peg due to liquidity constraints, incentivizing market makers to restore equilibrium.
Key Stability Mechanisms:
Fiat-Backed: Reserves held in regulated banks (e.g., USDC by Circle and Coinbase Custody). Crypto-Backed: Overcollateralized with other cryptocurrencies (e.g., DAI). Algorithmic: Dynamic supply adjustments (e.g., Terra’s UST, now obsolete post-2022 collapse).
Factors Propelling Cryptocurrencies to Surpass Traditional Currencies in Value
For a cryptocurrency to surpass traditional currencies in value, it must address three core challenges: adoption, regulatory legitimacy, and technological scalability. The following factors outline the path to such dominance:-
Adoption as a Medium of Exchange and Store of Value
- Institutional Adoption: Cryptocurrencies like Bitcoin are increasingly recognized as a digital gold—a hedge against inflation and currency devaluation. MicroStrategy’s $4.5 billion Bitcoin treasury and El Salvador’s legal tender status demonstrate growing institutional trust.
- Consumer and Merchant Adoption: Mass adoption requires seamless integration into daily transactions. Bitcoin’s Lightning Network and Ethereum’s Layer 2 solutions (e.g., Arbitrum, Optimism) aim to reduce transaction costs and latency, making crypto viable for microtransactions.
- Macroeconomic Conditions: Hyperinflation in countries like Venezuela or Argentina accelerates crypto adoption as a stable alternative. For example, Bitcoin’s market cap in Nigeria surged 300% in 2020 as the naira lost 30% of its value (Chainalysis, 2021).
-
Regulatory Clarity and Institutional Integration
- Legal Recognition: Countries like Switzerland (via the "Crypto Valley") and Singapore (via the Payment Services Act) provide regulatory sandboxes that foster innovation. The U.S. SEC’s evolving stance on Bitcoin ETFs (e.g., approval of spot Bitcoin ETFs in January 2024) signals growing institutional acceptance.
- Anti-Money Laundering (AML) and Know Your Customer (KYC) Compliance: Cryptocurrencies must integrate with global AML frameworks (e.g., FATF’s Travel Rule) to prevent illicit use while maintaining privacy. Projects like Privacy Pools (e.g., Tornado Cash) face scrutiny, highlighting the tension between regulation and decentralization.
- Central Bank and Sovereign Backing: A cryptocurrency backed by a major economy (e.g., a sovereign Bitcoin ETF or a CBDC hybrid) could bridge trust gaps. For instance, the Bahamas’ Sand Dollar (BSD) is a CBDC that operates alongside traditional currencies, offering a model for hybrid systems.
-
Technological Scalability and Security
- Blockchain Throughput: Bitcoin’s 7 transactions per second (TPS) and Ethereum’s 15-30 TPS (pre-L2 solutions) pale in comparison to Visa’s 24,000 TPS. Scalability solutions like Bitcoin’s Taproot upgrades and Ethereum’s sharding aim to address this, but real-world adoption remains limited.
- Energy Efficiency: Proof-of-Work (PoW) networks like Bitcoin face criticism for high energy consumption (~120 TWh annually, per the Cambridge Bitcoin Electricity Consumption Index). Transitioning to Proof-of-Stake (PoS) (as Ethereum did in 2022) reduces energy use by 99.95% while maintaining security.
- Interoperability: Cross-chain protocols (e.g., Polkadot, Cosmos) enable seamless asset transfers between blockchains, reducing fragmentation. For example, Wrapped Bitcoin (WBTC) allows Bitcoin to interact with Ethereum’s DeFi ecosystem.
Critical Mass Threshold:
A cryptocurrency must achieve critical mass in at least one of three domains—institutional adoption, retail usage, or regulatory endorsement—to surpass fiat in value. Bitcoin’s market cap ($1.2 trillion as of 2024) reflects its status as the closest contender, but scalability and adoption remain bottlenecks.
Pathway for a Central Bank Digital Currency (CBDC) to Become the Most Valuable Digital Asset
The evolution of a CBDC into the most valuable digital asset follows a structured, multi-stage process integrating pilot programs, monetary policy alignment, and global adoption. Below is a textual flowchart outlining the critical stages:1. Pilot Phase (Proof of Concept)
2. Regulatory and Legal Framework
3. Monetary Policy Integration
4. Cross-Border and Institutional Adoption
The most valuable currencies are not merely reflections of economic strength but products of deliberate policy, cultural trust, and adaptive resilience in the face of disruption. Whether through the USD’s dominance as a reserve currency, the Kuwaiti Dinar’s unparalleled purchasing power, or the potential of stablecoins to streamline cross-border transactions, value is ultimately a construct of perception and utility. As digital currencies and central bank innovations continue to evolve, the question of what currency is worth the most may no longer hinge solely on historical prestige or commodity backing—but on agility, adoption, and the ability to embed itself into the fabric of global commerce. The future of currency value lies at the intersection of tradition and transformation, where stability meets innovation.
FAQ
Which currency is currently the most valuable in the world?
The Kuwaiti dinar (KWD) is the highest-valued currency in circulation, trading at around 3.25 USD per 1 KWD as of recent rates. The Bahraini dinar (BHD) and Omani rial (OMR) also rank among the strongest, with values near 2.65 and 2.60 USD respectively.
Which currency has the highest value when converted to US dollars?
The Kuwaiti dinar (KWD) holds the top spot, as 1 KWD equals roughly 3.25 USD. Other high-value currencies include the Bahraini dinar (1 BHD ≈ 2.65 USD) and the Omani rial (1 OMR ≈ 2.60 USD).
What is the most valuable currency in the world right now?
As of current exchange rates, the Kuwaiti dinar (KWD) remains the most valuable, followed closely by the Bahraini dinar (BHD) and the Omani rial (OMR). Rates fluctuate daily, but these currencies consistently lead.
Which currency is worth the most money in terms of purchasing power?
The Kuwaiti dinar (KWD) and Bahraini dinar (BHD) rank highest in purchasing power due to their high USD value and strong economies. However, currencies like the Swiss franc (CHF) or U.S. dollar (USD) may offer better global purchasing power in practice.
Which currency is worth the most compared to the US dollar?
The Kuwaiti dinar (KWD) is the strongest, with 1 KWD equaling about 3.25 USD. The Bahraini dinar (BHD) and Omani rial (OMR) also outperform the USD, with ratios around 2.65:1 and 2.60:1 respectively.
What is the most valuable currency in the world today?
Today, the Kuwaiti dinar (KWD) is still the highest-valued currency, followed by the Bahraini dinar (BHD) and Omani rial (OMR). These Gulf currencies maintain their dominance due to oil wealth and pegged exchange rates.
Leave a Comment
Comments are moderated before appearing. The data you submit is processed according to the Privacy Policy of Voltefac.