
Claims are often made in the mass media by politicians and ‘drug experts’ about how lethal certain kinds of drug use are, particularly compared with recreational activities. For instance, drug prevention campaigns have often promoted sport as a healthier alternative to drug use – but is it? Professor Nutt famously claimed that ecstasy use is safer than horse riding – but is it?
My Drug Mortality Risk Chart, a chart of the relative mortality risks of different kinds of drug use, leisure activities and other ‘exposures’, provides an evidence-based system for evaluating such claims, and can answer such burning questions as: Is heroin use more lethal than giving birth or canoeing? Are you more likely to survive LSD use than riding a bicycle? Is smoking cannabis more likely to kill you than breathing air?
The Apex Harm: drug-related deaths
“The fear of death is the most unjustified of all fears, for there’s no risk of accident for someone who’s dead.”
I first began theorizing about the relative harmfulness of drugs over three decades ago (Newcombe 1987, Newcombe 1992). In the mid-1990s, I published papers reviewing the evidence about the mortality risks of heroin use versus methadone use, and ecstasy use versus amphetamine use (e.g., Newcombe 1996, Newcombe 1997). I’ve also used statistics and research studies on drug-related deaths and other harms as an evidence base for all of the books, leaflets and videos on safer drug use I’ve helped to produce over the last three decades – including Dr Nuke’s guides to cannabis (1995), amphetamines (2002), magic mushrooms (2004), and hallucinogens (2004): Potology, Whizzology, Tripology and Magic Mushrooms. Since then, many other people and organisations have made significant contributions to assessing the harmfulness of different drugs, notably the UK Drug Harm Index (see Newcombe 2007) and Nutt’s rational scale of drug harmfulness (e.g., Nutt 2007).
Based on these foundations, and the concepts provided by risk assessment science and application of my model of harm reduction (Newcombe 2010, Newcombe 2017), I have developed a chart which rank orders the mortality risks for different kinds of drug use and comparable activities and events – notably in the domains of leisure, work, home and nature. Death was chosen as the comparative harm not just because it is the apex harm and top-rank risk of drug use, but also because it was the only harm for which there was enough evidence to construct such comparisons.
Official statistics on drug-related deaths are released every year for each of three ‘countries’ within the UK: England & Wales (ONS 2022), Scotland (NRS 2022), and Northern Ireland (NISRA 2022). These annual bulletins cover most psychoactive drugs other than the three which are licensed for recreational use (alcohol, tobacco/nicotine and caffeine) – namely:
- drugs controlled under the 1971 Misuse of Drugs Act (MoDA) – most of which are ‘illegal’ to possess only if they’re not prescribed by a doctor, and some of which are designated as having no medical use (notably hallucinogens and plant-based drugs);
- uncontrolled pharmaceuticals like prescription medicines for mental disorders (e.g., anti-depressants and anti-psychotics) and over-the-counter analgesics (e.g., aspirin and paracetamol); and
- new psychoactive substances (e.g., some SCRAs), some natural highs (e.g., salvia, peyote and fly agaric), and various ‘grey area’ intoxicants marketed for other purposes (e.g., gases like nitrous oxide, and solvents such as butane and glue) – many of which are not controlled by MoDA nor dispensed from pharmacies as prescription or OTC medicines (mortality statistics for some of these are reported in other bulletins).
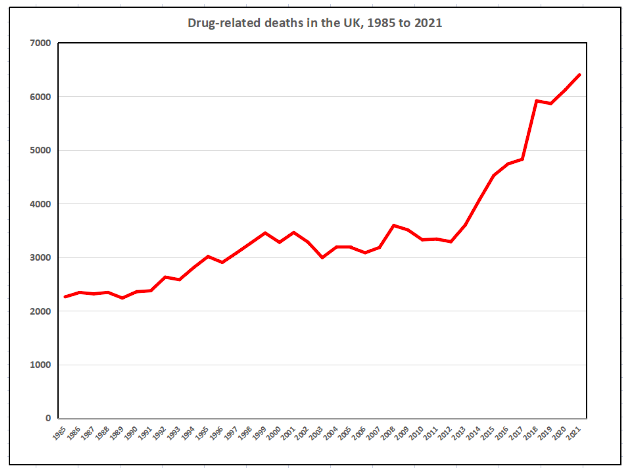
Although methods of recording and reporting drug-related deaths vary between UK countries and across time, the total UK number climbed from 2,260 in 1985 to just over 3,000 in 1995 and just over 4,000 in 2014, and reached a record 6,401 deaths in 2021 (see Graph). While the number of drug-related deaths has risen across all regions of the UK – with a notably steep rise over the last decade – the prevalence of last-year drug use has fallen over the 21st century. In England and Wales, the proportion of adults aged 16 to 59 years who reported drug use over the last year fell from a record 12% at the start of the century to between 8% and 9% over the last decade. This means the annual drug-related mortality rate has risen even more steeply than the number of drug-related deaths.
But which drugs underlie this unprecedented rise in the number and rate of drug-related deaths? The chart presented here permits systematic comparisons of claims that certain drugs are more likely to cause death than other drugs or comparable leisure activities or life experiences. Having garnered feedback on “Dr Nuke’s Drug Mortality Risk Chart” online (e.g., Twitter) over recent years, I’ve now updated the relevant statistics and tightened up the underlying model – and this is the first publication of it.
What’s the purpose of the chart? First, it helped me focus my obsession with both drugs and statistics, and to use frequent bouts of insomnia constructively. Second, and more importantly, drug-related harm reduction (HR) is now almost 40 years old, and the design, delivery and evaluation of HR interventions would clearly benefit from more sophisticated conceptual models and evidence-based resources. Drug-related risk/harm charts like the Drug Mortality Risk Chart provide much-needed HR tools, both to people trying to make informed decisions about safer drug use, and also to professionals working to reduce harm among people who use drugs – including those in specialist and generic services, and particularly in the education, research and training sectors.
Constructing the Drug Mortality Risk Chart
“If you resolve to give up smoking, drinking and loving, you don’t actually live longer; it just seems longer.“
Clement Freud, The Observer, 27 December 1964
Slicing up pieces of our lives and calling some effects (like death) and others causes (like drug use and leisure) is a conceptual construction which inevitably involves a plethora of questionable assumptions and difficult decisions.
There are three main types of drug-related death:
poisoning/overdose (typically resulting in organ failures, like brain seizures, cardiac arrest and respiratory failure);
diseases (both infectious, e.g., hepatitis, and cellular, e.g., cancer);
and injuries arising from drug consumption and/or intoxication (e.g., deficits in cognition and performance leading to driving accidents). Some official statistics on drug-related deaths also encompass suicides and homicides involving drugs, notably intentional drug overdoses and murders by or on people who use drugs.
The implicit causes of deaths from drug use and other activities are often built into the rules and categories of the counting system. For instance, if a heroin user died from shooting up a standard dose of heroin cut with a lethal dose of fentanyl, then this could be counted as a heroin-related death, a fentanyl-related death, or a poly-drug death. Similarly, if a drunken man drowned while trying to swim in a fast-flowing river, the multiple causes of the accidental death might be described as including alcohol use (drug), poor decisions about swimming (set), and a treacherous river (setting). Indeed, death is typically brought about by a variety of causes classifiable at different levels – including such causal categories as function, distance, direction, and type. For instance, causes can be triggers or predispositions, proximate or distal, inhibitory or facilitatory, and biological or psychosocial.
The Drug Mortality Risk Chart skates over much of this complexity by construing drug use and other activities as the causes of death – with the probability of them causing death forming the nine levels of risk. The methodology underlying the chart is based on evidence about the case fatality rates for ‘exposures’ to drug use and other activities in the UK, defaulting to England & Wales or England when UK-level figures are not available. These crude mortality rates are generated by dividing the latest annual mortality figures for relevant exposures (numerators) by estimates of the number of people who were exposed to the activity/event at least once over the same, or closest, year (denominator).
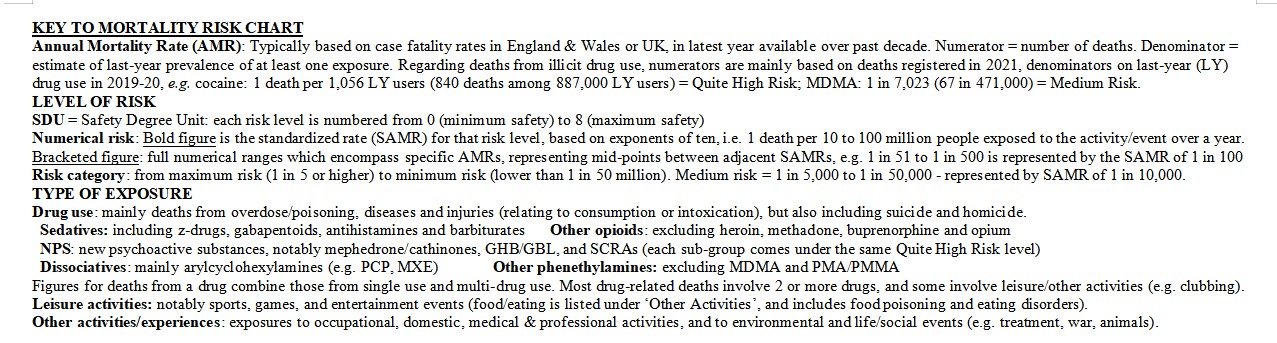
In the case of illicit drug use, case fatality rates were mostly derived from two main sets of recent official statistics, namely: the number of drug-related deaths registered in England & Wales in 2021, many of which occurred in the previous year (ONS 2022); and the number of 16-59 year old people who reported using drugs at least once over the previous 12 months in the 2019/20 Criminal Survey for England & Wales (ONS 2020) (the latest CSEW figures for 2021/22 were not utilized, as levels of drug use were heavily impacted by the Covid and lockdown years). Mortality statistics related to the use of alcohol, tobacco, and prescribed drugs were also obtained from annual government bulletins.
The criterion of ‘at least one exposure in the last year’ was employed for denominators because it is a standard definition for ‘last-year use’ in prevalence research – though it should be clear that last-year use includes all frequencies of drug-taking– from once a year, to daily use. Although some people are unlucky enough to die the only time they take a psychoactive drug like ecstasy or heroin (e.g. from allergic or idiosyncratic reactions), the evidence suggests that most such deaths involve more frequent or heavy consumption rather than one-off use (notably from poisoning, overdoses or disease). However, the Drug Mortality Risk Chart does not cover how such consumption variables affect mortality risk levels, because the available evidence for comparisons like occasional versus regular use and light versus heavy use are too patchy and scarce to permit systematic classifications and comparisons.
Mortality figures for leisure activities and other exposures (notably activities and events involving work, home, medical interventions and nature) were derived from multiple sources (notably ONS mortality statistics) – as were estimates of the number of people exposed to the activity or event. For instance, the mortality rate for using a helicopter was based on the number of reported deaths from helicopter crashes/injuries and the estimated number of people who flew in a helicopter in the same year – i.e., one death per X number of people exposed. The denominator for the most common/ everyday experiences and behaviours (e.g., watching television, using beds, cooking) was assumed to be the whole national population or all adults.
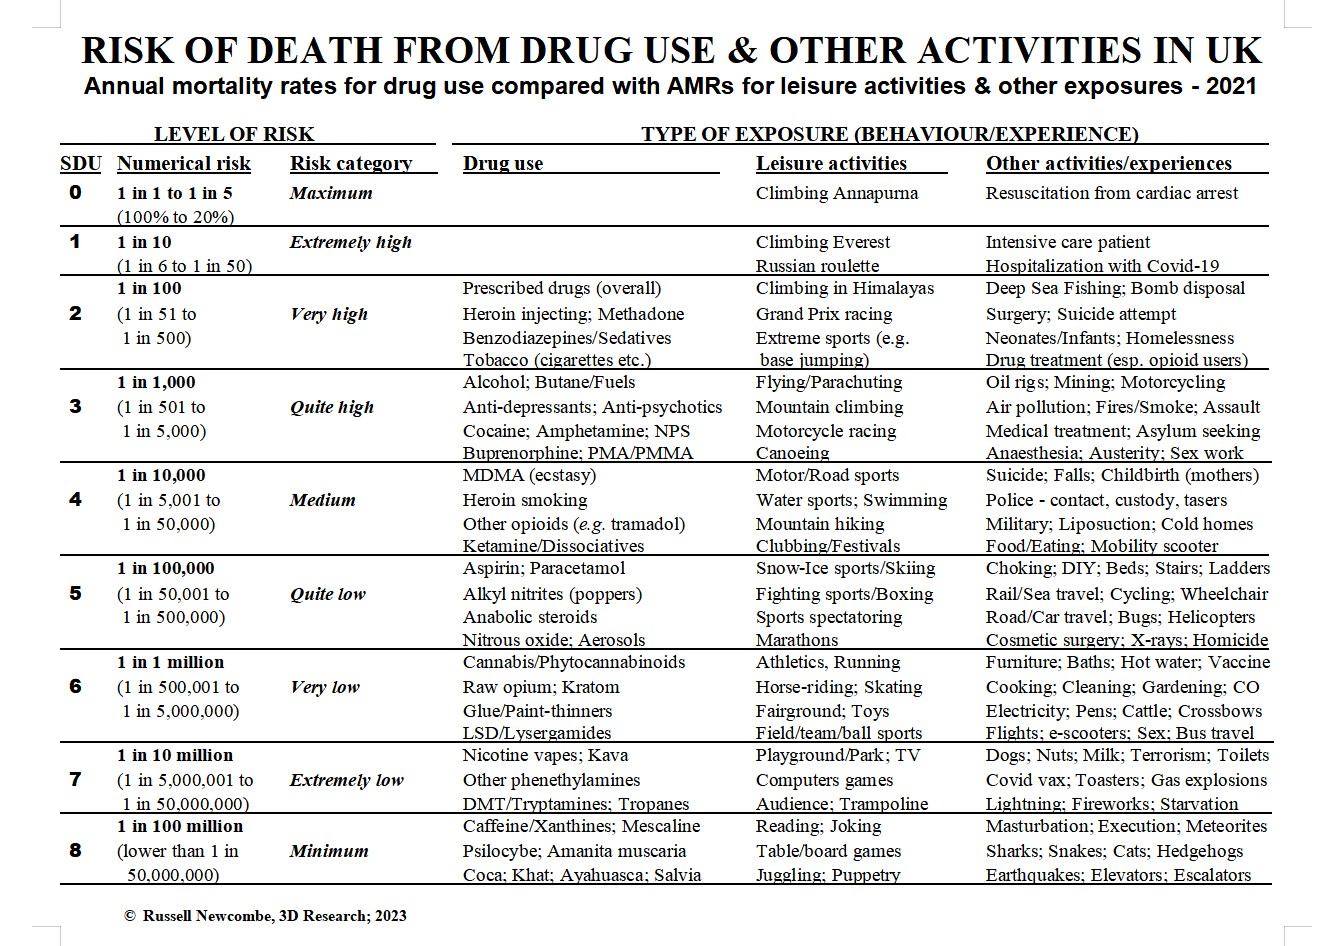
The annual mortality rates derived from these calculations are based on many operational definitions and estimation methods which there isn’t space to fully describe here (though see the Key to the Chart). Briefly, after the annual mortality rate (AMR) for an exposure had been calculated, it was then assigned to one of nine levels of risk, ranging from maximum to minimum risk, with medium risk in the middle – and extremely, very or quite high/low risk making up the three risk levels between maximum and medium, and between medium and minimum. Each risk level is represented by a standardized AMR (SAMR) based on an exponent of ten (e.g., 1 in 102, or 1 in 100 = very high risk). Each SAMR is used to simplify and represent the nine ranges of AMRs, which are mutually exclusive and totally exhaustive. These rate ranges are derived by selecting the mid-points between total risk (1 in 1) and each adjacent SAMR (e.g., the AMR range of 1 in 51 to 1 in 500 is represented by the SAMR of 1 in 100). Safety Degree Units (SDUs), which number the risk levels from zero to eight, indicate the level of safety from mortality (the inverse of risk).
Whatever its weaknesses and shortcomings, the Drug Mortality Risk Chart provides an evidence-based starting-point for more valid and reliable models to be developed. And although it provides some striking comparisons and a few surprises, I’m confident that those with expertise in drug use and drug-related harms will find it fits with both the scientific evidence and their broader experience.
The Drug Mortality Risk Chart
Highlights and lowlights of the Chart
“Life is a sexually transmitted disease and the mortality rate is one hundred percent.”
R D Laing (1961), Self and Others
Even a quick glance at the Chart reveals a mixture of predictable and surprising classifications and comparisons – though some of these derive from artifacts like very high or low prevalence. The remainder of this article will focus on the mortality risks of some of the most popular and problematic kinds of drug use and comparable activities – particularly in relation to assessing common beliefs and claims about how likely they are to kill people.
Legal drugs
One widely-held belief rooted in prohibition propaganda emerging from government agencies and their mass media mouthpieces is that the use of legal and/or licensed drugs is less lethal than the use of most illicit drugs. While deaths from illicit drug use typically involve syndromes linked to overdose or poisoning, deaths from alcohol and tobacco are more often based on diseases to body organs which occur after several decades of use (e.g., cancer) – as well as accidents and violence in the case of alcohol. Far less is known about the long-term effects of illicit drug use or how many violent deaths they may be linked to.

Keeping these evidential differences in mind, the chart shows that drinking caffeine beverages, which is linked to only one or two deaths each year, shares with the use of illicit plant-based psychedelics the lowest mortality risk possible. By contrast, our two most popular forms of licensed drug use – alcohol drinking and tobacco smoking – are far more lethal than use of most illegal drugs. Tobacco use is as lethal as drug use gets – an AMR of 1 in 75 – and is classified alongside heroin injecting (1 in 150) as a very high risk form of drug use. Alcohol use, involving one death for around every one or two thousand last-year users (depending on whether you count violent deaths and traffic accidents alongside long-term disease deaths) is the next risk level down: quite high risk. Along with use of prescription anti-depressants and anti-psychotics, alcohol use has a comparable level of mortality risk to illicit use of cocaine or amphetamine.
Turning to other activities, the minimum mortality risk of caffeine use is comparable to the risk from playing board games, masturbating, or having a pet cat. By contrast, smoking tobacco is as likely to kill you as participating in Grand Prix racing, climbing mountains in the Himalayas, or doing bomb disposal work; while drinking alcohol is as lethal as mountain climbing, motorcycling and oil rig work.
The chart also provides evidence regarding the current disagreements between different agencies about whether using nicotine is safer than smoking tobacco. It shows that vaping nicotine has an AMR of about one in 10 million, compared with around 1 in 100 among those who smoke tobacco. Indeed, the likelihood of death from vaping nicotine is comparable to the extremely low risk associated with using toilets or toasters, playing computer games or watching television.
Illegal drugs
Supporters of drug policy reform often claim that deaths associated with controlled drugs have more to do with the impact of prohibition than the toxicity of the drugs or the consumption practices of the user. Although this claim is often the source of emotional arguments between prohibitionists and reformers, the relative causal contributions of these variables is difficult to disentangle in practice. Advocates of legalizing cannabis often claim that no-one has ever died from using cannabis, and that official statistics reporting cannabis-related deaths are dodgy and dubious. Indeed, research on the relative toxicity of different drugs shows that phytocannabinoids like THC are relatively harmless. For instance, the safety ratio for THC – the ratio between the ED50 (average effective dose) and the LD50 (average lethal dose) – is over 1,000 to 1. Along with psilocybe and LSD, cannabis is about as non-lethal as drugs can get (Gable 2004). Fatal accidents relating to intoxication by hallucinogens or cannabis have been reported, though they remain rare (typically fewer than one or two a year).
Cannabis was reported to be involved in 26 of the drug-related deaths registered in 2021. However, based on the above-mentioned safety ratio, this is very likely an artifact produced by the recording system, i.e. cannabis may sometimes get listed as one of the contributory drugs in poly-drug deaths (e.g., heroin with cannabis) – when it probably played no role at all. Over 80% of the 26 cannabis-related deaths were poly-drug deaths – meaning no more than five of the 26 deaths involved cannabis alone, and three of these may have involved alcohol. Based on this adjusted figure, cannabis use falls into the very low risk category (around one or two deaths per million users) – though it could arguably be down-classed to extremely low risk. Either classification makes cannabis less likely to kill its users than any drug other than psychedelics, plant-based drugs, nicotine and caffeine. It should also be noted that SCRAs (synthetic cannabinoid receptor agonists, e.g. Spice) have a much higher mortality risk than natural cannabis. That is, like other kinds of new psychoactive substance (NPS), the mortality risk of synthetic cannabinoids is ranked as quite high, compared with very low to extremely low for phytocannabinoids.

Compared with leisure activities, cannabis use is no more lethal than ball sports or playing with toys, and its AMR is comparable to the risk of death associated with cooking, bathing or gardening. And to answer one of the ‘burning’ questions this article began with: breathing air is more likely to kill you than inhaling cannabis smoke or vapour. This is due to air pollution, which is estimated to be responsible for 36,000 deaths in the UK every year – giving an AMR of one death from air breathing for every 2,000 air-breathers (PHE 2019), compared with lower than one in a million for inhaling cannabis fumes. Strange but true!
Turning to stimulants, although about two-thirds of the deaths associated with use of cocaine and MDMA are poly-drug deaths, their causal contribution to such deaths is much more plausible than that of cannabis in comparable cases. Many MDMA-related deaths are attributable to syndromes involving overheating and dehydration, typically in dance clubs and parties; while cocaine-related deaths often involve heart disorders and brain seizures associated with heavy, frequent or long-term use. The AMRs for each stimulant have risen over the past decade, partly due to significant increases in the strength of ecstasy tablets (from below 50 mg in 2010 to over 100 mg in 2020) and cocaine powder (purity of police seizures rose from around 20-30% in 2010 to over 60% in 2020). Though last-year use of MDMA shows no clear trends over the same decade (hovering between 400,000 and 550,000), last-year use of cocaine has grown more steadily from less than 700,000 to nearly a million.
 Professor Nutt famously claimed that ecstasy use is less lethal than horse riding (Nutt 2009) – which contributed to him getting kicked off the Advisory Council on the Misuse of Drugs (ACMD) by the Home Office. My chart classifies MDMA use as medium risk (around 1 in 10,000), compared with a very low risk for horse riding of around 1 in a million (though the AMR for horse riding is trickier to estimate). Though the number of MDMA-related deaths when Nutt made this claim in 2009 was lower than in 2021 (27 compared with 67), and the respective AMRs climbed from around 1 in 20,000 to 1 in 7,000, a medium risk classification remains applicable to both years. The chart shows that use of MDMA is much less likely to cause death than heroin injecting, tobacco smoking, alcohol drinking or cocaine snorting and smoking; while having a similar risk to ketamine use, and being more lethal than use of cannabis and most hallucinogens. Turning to other activities, MDMA use is in the same mortality risk category as swimming and motor sports, and is comparable to the risk of liposuction, mobility scooters and living in a cold home. Cocaine use is classed as a quite high risk for mortality – a level higher than MDMA use, but comparable to the risk of using other illicit stimulants like amphetamines and cathinones, and to the risks presented by mountain climbing to climbers, medical treatment to patients, or the UK government’s austerity policy to its citizens.
Also, although the risk of death from using amphetamine is a level higher than that for MDMA use, most people would not have known this from reporting on these deaths in the mass media. That is, reports of amphetamine-related deaths are rarely reported by journalists, while ecstasy-related deaths are more routinely reported (Newcombe 1997).
Heroin has traditionally been regarded as the most lethal of all the popular drugs, even among opioids, particularly because of its potential for overdose. Does it deserve this reputation? One difficulty is that heroin and morphine deaths are lumped together in the statistics, mainly because drug tests often cannot distinguish them (unless heroin’s unique metabolite, 6-MAM, is tested for). After adjustments for this and other problems, heroin use is classed overall as quite high risk for mortality, like alcohol and cocaine use.
However, while some drugs are mostly consumed by one route of use – notably alcohol (swallowing) and tobacco (smoking) – other drugs are commonly used by two or more methods of use. Although not enough evidence was available to distinguish the AMRs of most such drugs by method of use, there was sufficient evidence (and justification) in the case of heroin to compare its two main methods of use: smoking (most users) and injecting (some users). Heroin injecting has an AMR in the very high risk category (around 1 in 100), which contrasts with heroin smoking, which falls under medium risk (around 1 in 10,000) – two levels lower. The chart shows that whereas heroin injecting is as about as risky as smoking tobacco or swallowing sedatives, heroin smoking is only about as risky as swallowing MDMA or snorting ketamine. A major reason for this is that an overdose of heroin is much easier to achieve by injecting, because the whole dose is delivered with one press of the syringe plunger. By contrast, the same dose of heroin ‘chased’ on a foil would be consumed over several inhalations, allowing a slower delivery of heroin to the brain and body, and giving the user control over titrating their dose. Indeed, my reviews of relevant research and press reports have rarely identified any cases of fatal overdose on heroin alone among users who smoke it. Thus, smoking heroin presents a medium risk of death (typically as part of a poly-drug overdose), and is comparable to the mortality risk presented by childbirth, eating food (mainly from food poisoning or choking) or having contact with the police (mainly from deaths during arrest or while in custody) – and safer than canoeing or riding a motorbike. By contrast, the very high mortality risk associated with injecting heroin (typically from overdose or infectious diseases) is comparable to that of participating in extreme sports or deep sea fishing.
Another interesting observation is that use of methadone, the drug prescribed as a ‘safer’ substitute for illicit heroin to opioid users, is classified as having a very high mortality risk – the same as heroin injecting. The reasons for this are complex, and risk factors include poly-drug use, low tolerance in new users or following relapse, and illicit use of diverted prescription methadone (see Newcombe 1996). For instance, while 100 mg of methadone would simply reduce withdrawals in someone with a big heroin habit, it’s the LD50 for non-tolerant users, i.e. would kill about half of them. By contrast, use of raw opium is classed as very low risk – though this may be an artifact, i.e. more to do with opium’s very low prevalence of use in the UK than its relative overdose potential.
There are many more interesting comparisons which cannot be covered here, but I will finish with a selection of some of the more striking examples:
- inhaling nitrous oxide or the fumes of poppers carries the same level of mortality risk as use of aspirin or paracetamol (quite low)
- both tripping on LSD and sniffing glue are categorized as having a very low risk of death – despite glue’s reputation as a killer and LSD’s contrasting non-toxic image – they are as safe as field sports and riding a bus, and safer than snow sports or riding a bike
- DMT smoking and nicotine vaping share an extremely low risk of death, but that’s about all they share (unless machine elves can help you give up tobacco) – so they shouldn’t be regarded as interchangeable!
- chewing of khat or coca has the lowest mortality risk of all – comparable to the minimum risk of death associated with drinking coffee or tea. Indeed, the most salient differences between all of these natural stimulants used by humans to work, rest and play are cultural and legal.
Conclusions: ‘How to get high, but not die’
“Some of us may die. But, statistically, it is not likely to be you.”
Scars, ‘Your Attention Please’ (1981)
“I believe that drugs have destroyed many lives, but wrong government policies have destroyed many more.”
Kofi Annan, Former Secretary General of United Nations
I hope this initial overview of my Drug Mortality Risk Chart has improved your knowledge and challenged some of your beliefs about the relative mortality risks of drug use, leisure activities and other life events. Inevitably, an analysis of this depth and size will have weaknesses and limitations, but my 40 years of research experience in the drugs field make me confident that the chart presents a fairly reliable picture of the relative mortality risks of different kinds of drug use and leisure activity.
This paper also provides a starting point for designing tools for both drug users and professionals to assess the relative risks and likely harms of drug use, and to compare them with other recreational activities and life events, from sport to work. More sophisticated conceptual frameworks need to be developed, based on comprehensive classifications of drug-related harms and benefits, and improved techniques for estimating levels of risk and safety. Such models will require better quality estimates of the prevalence of activities like using drugs and participating in leisure pursuits, encompassing consumption variables like frequency of use and setting of use for all salient drug-related harms, including disease, health damage, mental disorder and social problems. We are currently a long way from being able to to do these things.
Last, there is growing evidence that many deaths and other harms related to the use of illicit drugs can be reduced by harm reduction interventions, including: enabling a safer supply of drugs through legal regulation or specialist prescribing; providing targeted information and advice on safer drug use; giving users up-to-date information on the purity and adulteration of illicit drugs via drug checking services; making safer drug-taking equipment available through services like needle exchange; providing antidotes for overdoses like naloxone; and offering safer settings for drug use like supervised injecting rooms (see HRI 2022). Models which permit assessment of changes in the levels of drug-related risk and harm over time can provide evidence useful to evaluating the effectiveness of these interventions.
Perhaps the most important conclusion which can be drawn from the present analysis is that most kinds of illicit drug use are nowhere near as lethal as would be assumed from reading mass media reports or heeding government warnings, and that two of our three legal psychoactive drugs – alcohol and tobacco – are far more likely to kill you than most prohibited drugs. Moreover, many sports and leisure activities which have been recommended as legal, healthy alternatives to drug use are more likely to kill you than the illicit drug use they would replace. In short, the comparative mortality statistics presented here support the growing evidence from many sources that UK prohibition and the abstinence-oriented interventions on which it is based – prevention, enforcement, treatment – are both ineffective and unjustified (e.g., Holland 2020, Transform 2022). These conclusions, of course, extend beyond the UK to the international drug prohibition that has been failing the world for the last 60 years.
Dr Russell Newcombe, 3D Research, Liverpool, UK. Dr Russell Newcombe is a social psychologist and drug researcher, specialising in drug use (prevalence and consumption), the psychosocial effects of drugs, the reduction of drug-related harms and risks and on drug policy reform. Tweets @TheNewImpostor