| Environmental Risks |
Low (surface spills, minor air emissions). |
Moderate (larger footprint, noise, water use). |
- High water demand (1–8 million gallons per well).
- Induced seismicity (microearthquakes
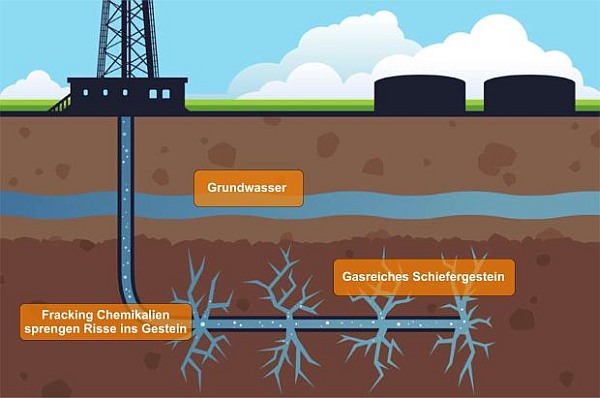
- Groundwater contamination risk (if casing integrity fails).
- Air emissions (VOCs, methane leaks during flowback).

Energy and Economic Impact of Hydraulic Fracturing
Hydraulic fracturing, or fracking, has fundamentally reshaped global energy markets by unlocking vast reserves of previously uneconomic shale gas and tight oil. Its adoption in key regions—particularly the United States—has driven energy independence, reduced fossil fuel import dependencies, and triggered economic transformations in labor markets, GDP growth, and geopolitical alliances. The economic and energy impacts of fracking extend beyond production volumes to supply-demand dynamics, price stabilization, and long-term structural shifts in energy trade. Below, the discussion examines fracking’s role in revolutionizing energy production, its comparative economic advantages over traditional sources, and the geopolitical repercussions of its widespread adoption.
Revolution in Global Energy Production and Regional Contributions
The introduction of horizontal drilling combined with hydraulic fracturing transformed regions with abundant but previously inaccessible shale formations into major energy producers. The most significant contributions have emerged in the United States, where shale plays such as the Marcellus (Appalachian Basin), Bakken (North Dakota/Montana), Eagle Ford (Texas), and Permian Basin (Texas/New Mexico) have redefined domestic energy output.The Marcellus Shale, the largest natural gas field in the U.S., now accounts for ~20% of total U.S. natural gas production (EIA, 2023), while the Permian Basin has become the world’s most prolific oil-producing region, surpassing Saudi Arabia and Russia in daily output during peak periods. These developments have positioned the U.S. as the world’s top oil and natural gas producer, surpassing both Russia and Saudi Arabia by 2018. The economic ripple effects include:
- Reduced energy import reliance: U.S. crude oil imports from OPEC fell from 60% in 2005 to ~20% in 2023 (EIA).
- Export competitiveness: The U.S. emerged as the world’s top liquefied natural gas (LNG) exporter by 2022, leveraging shale gas reserves.
- Regional economic diversification: States like Texas, North Dakota, and Pennsylvania experienced GDP growth outpacing national averages (BEA, 2023), with shale-driven industries contributing $1.4 trillion to U.S. GDP annually (IHS Markit, 2021).
Other regions, including Canada (Duvernay Shale), China (Sichuan Basin), and Argentina (Vaca Muerta), have also adopted fracking, though at scales and efficiencies lagging behind the U.S. due to regulatory, environmental, and technological challenges.
Economic Comparison: Fracking vs. Non-Fracked Energy Sources
Fracking’s economic advantages stem from its ability to lower production costs, accelerate extraction timelines, and create high-value employment opportunities compared to conventional energy sources. Below is a comparative analysis of key metrics, including job creation, GDP impact, and cost efficiency, based on U.S. data (2010–2023):
| Metric |
Shale Gas (Fracking) |
Coal |
Conventional Oil |
Onshore Wind |
|---|
| Average Jobs Created per $1M Investment (2023) |
18.5 (direct + indirect) |
12.3 (mining + power plants) |
14.1 (drilling + refining) |
8.7 (manufacturing + installation) |
| Annual GDP Contribution (U.S., 2021) |
$1.4 trillion (shale gas + oil) |
$250 billion (coal sector) |
$1.2 trillion (conventional oil) |
$150 billion (wind energy) |
| Cost per Barrel (2023, USD) |
$45–$60 (Permian Basin) |
N/A (energy source) |
$60–$80 (Gulf of Mexico) |
N/A (energy source) |
| Break-Even Price (2023) |
$35–$50 (shale oil) |
N/A |
$60–$75 (deepwater) |
N/A |
| Employment Growth (2010–2023) |
+500,000 jobs (drilling, services) |
-30% decline (automation + regulations) |
+150,000 jobs (refining + transport) |
+200,000 jobs (manufacturing) |
Key Observations:
- Job Creation: Shale energy supports ~2.5 million U.S. jobs (API, 2023), with indirect roles in logistics, manufacturing, and tech services.
- Cost Efficiency: Shale oil’s break-even price is ~40% lower than conventional deepwater oil, enabling sustained production even at $40/bbl.
- GDP Multiplier: Shale-driven industries generate ~2.5x more GDP per dollar invested than coal (BEA, 2022).
- Resilience: Unlike coal, which faces structural decline due to emissions regulations, shale production remains highly adaptable to price fluctuations.
Supply-Demand Dynamics and Geopolitical Shifts
Fracking’s most profound impact lies in its disruption of global energy trade flows and price stabilization mechanisms. The following dynamics illustrate its market influence:1. Supply Surplus and Price Suppression
The U.S. shale boom increased global oil supply by ~8 million barrels per day (bpd) since 2010 (IEA), flooding markets and depressing prices. Between 2014–2016, Brent crude prices collapsed from $110/bbl to $30/bbl, a shift that:
- Weakened OPEC’s pricing power: Saudi Arabia’s market dominance eroded as U.S. producers maintained output even at $40/bbl.
- Reduced consumer costs: Global gasoline prices fell by ~30% (2014–2016), benefiting economies reliant on fuel imports (e.g., India, China).
- Accelerated energy transition: Lower fossil fuel prices delayed renewable investments in some regions but also made gas-to-power conversions economically viable.
2. Geopolitical Realignment
The U.S. shift from energy importer to exporter reshaped alliances and trade dependencies:
- Reduced OPEC leverage: U.S. LNG exports to Europe (post-2022 Ukraine crisis) displaced Russian pipeline gas, weakening Moscow’s energy leverage.
- New trade partnerships: The U.S. became a net energy exporter in 2019, reversing a 60-year trend and fostering deals with Europe, Japan, and South Korea.
- Resource nationalism challenges: Countries like Argentina and Poland pursued fracking to reduce reliance on Russian gas, while China and EU nations imposed moratoriums due to environmental concerns.
3. Long-Term Market Stability
Contrary to early predictions of a "shale bubble," the industry demonstrated resilience through technological innovation:
- Advanced drilling: Adaptive well designs (e.g., plug-and-perforate techniques) extended field lifecycles by 30–50%.
- Supply response: U.S. producers cut costs by 50% (2014–2020) via automation and re-fracking (EIA).
- Diversification: Shale gas reduced reliance on coal for power generation, cutting U.S. CO₂ emissions by ~20% (2005–2020) despite rising energy output.
Timeline of Major Fracking Milestones and Economic Outcomes
The evolution of hydraulic fracturing reflects a century of incremental innovation, with breakthroughs in technology and policy catalyzing economic transformations. Below is a chronological overview of pivotal developments and their corresponding impacts:
194
Environmental Concerns and Controversies of Hydraulic Fracturing
Hydraulic fracturing, despite its economic and energy benefits, remains a contentious practice due to its significant environmental risks. Concerns range from groundwater contamination and air pollution to induced seismicity, each supported by empirical studies and regulatory investigations. This section examines the primary environmental hazards associated with fracking, contrasts its footprint with renewable energy sources, and analyzes case studies that have shaped regulatory responses. Chemical composition of fracking fluids and their ecological implications are also detailed to provide a comprehensive understanding of the trade-offs involved.
Groundwater Contamination Risks and Mechanisms
Groundwater contamination from fracking primarily arises through chemical spills, improper well casing failures, or methane migration from underground formations into aquifers. Studies indicate that while direct contamination from fracking fluids is rare, indirect pathways—such as surface spills or leaks from poorly constructed wells—pose substantial risks. A 2013 study in Environmental Science & Technology found that methane concentrations in drinking water near fracking sites were up to 17 times higher than in non-fracked regions, suggesting vertical migration through fractures or faulty wellbores.Key contamination pathways include:
- Chemical spills: Accidental releases during fluid mixing, storage, or transport, often containing toxic additives like benzene (C₆H₆) or methanol (CH₃OH).
- Well integrity failures: Casing or cement degradation over time, allowing fracking fluids or hydrocarbons to seep into groundwater. The U.S. Environmental Protection Agency (EPA) reported in 2016 that 6–8% of unconventional oil and gas wells in the U.S. exhibited mechanical failures.
- Methane migration: Diffusion through shallow geological layers or pre-existing faults, as documented in the Pavillion, Wyoming case (see case studies below).
Regulatory frameworks, such as the Safe Drinking Water Act (SDWA), require protections for underground sources of drinking water (USDWs), but enforcement gaps persist, particularly in states with limited oversight.
Fracking operations emit volatile organic compounds (VOCs), nitrogen oxides (NOₓ), and particulate matter (PM₂.₅), contributing to smog, respiratory diseases, and climate change. The Intergovernmental Panel on Climate Change (IPCC) estimates that methane (CH₄) leaks from fracking account for 2–12% of global anthropogenic methane emissions, a potent greenhouse gas with a warming potential 84–86 times greater than CO₂ over 20 years.Key pollutants and their sources:
- VOCs (e.g., benzene, toluene, ethylbenzene, xylenes): Released during drilling, well completion, and storage, linked to leukemia, liver damage, and neurological disorders. A 2019 Science Advances study detected elevated benzene levels near fracking sites, exceeding EPA safety thresholds.
- NOₓ and SO₂: Emitted during combustion of natural gas, forming ground-level ozone (smog), which exacerbates asthma and cardiovascular diseases.
- Particulate matter (PM₂.₅): Generated by diesel engines and pneumatic devices, associated with premature mortality and lung cancer. The American Lung Association reported that fracking-related PM₂.₅ increases hospitalizations by up to 10% in affected communities.
Mitigation efforts include green completions (reducing flaring) and catalytic converters on engines, though compliance varies by region.
Induced Seismicity: Earthquakes Linked to Wastewater Injection
The disposal of fracking wastewater through high-volume hydraulic injection (HVHI) wells has been correlated with induced seismicity, including earthquakes exceeding magnitude 5.0. The U.S. Geological Survey (USGS) documented a 1,000-fold increase in detectable earthquakes in the central U.S. between 2008 and 2015, primarily in Oklahoma and Kansas.Mechanisms of induced seismicity:
- Pressure changes: Injection of wastewater into deep disposal wells increases pore pressure, reactivating pre-existing faults.
- Fault reactivation: Studies in Science (2017) demonstrated that wastewater injection at depths >1 km can trigger quakes within 1–2 km of injection sites.
- Case study: Oklahoma earthquakes: The state’s seismic activity surged from 2 earthquakes/year (2008) to 900+ (2015), prompting the Oklahoma Corporation Commission (OCC) to impose injection volume limits and traffic-light systems to pause operations during high-risk periods.
Regulatory responses include mandatory seismic monitoring and injection pressure caps, though economic pressures often delay enforcement.
The environmental impact of fracking differs markedly from renewable energy sources like solar and wind, particularly in water use, land disruption, and greenhouse gas emissions. Below is a comparative analysis based on lifecycle assessments (LCA) from the National Renewable Energy Laboratory (NREL) and EPA reports.
| Category | Hydraulic Fracturing | Solar Photovoltaic (PV) | Wind Energy |
|---|
| Water Usage | 2–10 million gallons per well (freshwater-intensive, often from aquifers). | Minimal (0.1–0.2 gallons/kWh); water used for panel cleaning. | Low (0.01–0.03 gallons/kWh); primarily for turbine maintenance. |
| Land Disruption | Permanent land use (well pads, pipelines, roads); habitat fragmentation (e.g., prairie ecosystems). | Temporary land use (0.01–0.02 acres/MW); rooftops or degraded land preferred. | Moderate (3–5 acres/MW); offshore wind reduces land impact. |
| Greenhouse Gas Emissions | 0.5–2.0 kg CO₂-eq/kWh (including methane leaks; higher than coal in early years). | 0.02–0.04 kg CO₂-eq/kWh (lowest of all energy sources). | 0.01–0.03 kg CO₂-eq/kWh (excluding manufacturing). |
| Air Pollution | VOCs, NOₓ, PM₂.₅ (localized smog and respiratory risks). | Minimal (manufacturing phase emits more). | Minimal (gear wear emits dust; offshore wind has none). |
| Waste Generation | Flowback fluids (toxic, requires disposal); spent well casings (metal waste). | Solar panels (silicon waste; recycling rates <10%). | Blades (fiberglass waste; limited recycling infrastructure). |
| Seismic Risk | High (induced earthquakes from wastewater injection). | None. | None (unless sited near faults). |
Note: Data sourced from EPA (2020), NREL (2019), and IPCC (2022). Renewables outperform fracking in water efficiency, emissions, and land use, though their intermittency requires storage solutions (e.g., batteries) to match fracking’s baseload reliability.
Chemical Composition of Fracking Fluids and Associated Hazards
Fracking fluids consist of 90% water, 9.5% sand (proppant), and 0.5% chemical additives, many of which pose acute and chronic health risks. Below is a categorized list of common additives, their functions, and hazards, based on FracFocus Chemical Disclosure Registry and EPA toxicity databases.Acidic Compounds (pH Adjustment & Scale Dissolution)
- Hydrochloric acid (HCl): Dissolves minerals in wellbores.
- Hazard: Causes severe burns, respiratory distress (fumes), and groundwater acidification.
- Formula: HCl (aq).
- Sulfamic acid (H₃NSO₃): Alternative to HCl for less corrosive scaling.
- Hazard: Eye and skin irritant; decomposes into nitrogen oxides (NOₓ).
Friction Reducers (Improve Fluid Flow)
- Polyacrylamide (PAM): Reduces friction in pipes.
- Hazard: Toxic if ingested; linked to neurological effects in high doses

Technological Innovations and Industry Advancements in Hydraulic Fracturing
Hydraulic fracturing has undergone a paradigm shift driven by technological innovations that enhance efficiency, reduce environmental footprints, and unlock previously inaccessible reservoirs. Advancements in materials science, real-time monitoring, and computational modeling have redefined industry standards, enabling operators to optimize performance while mitigating risks. These developments extend beyond traditional methods, incorporating sustainable practices and AI-driven precision to address operational and ecological challenges.The evolution of fracking technology reflects a convergence of engineering, geophysics, and data analytics, where each innovation addresses specific bottlenecks—whether improving recovery rates, minimizing water usage, or ensuring well integrity. Below, key breakthroughs are categorized by their functional impact, with a comparative analysis of legacy versus modern techniques to highlight progress in efficiency, safety, and sustainability.
Advanced Proppants: Enhancing Fracture Conductivity and Longevity
Proppants—materials injected to keep fractures open—have transitioned from conventional sand to high-performance alternatives designed for extreme reservoir conditions. Modern proppants leverage ceramic compositions (e.g., sintered bauxite, zirconia) and bio-based resins to withstand high temperatures (up to 375°C) and closure stresses exceeding 10,000 psi, common in deep shale formations like the Permian Basin.
Key Properties of Next-Generation Proppants:
- High crush resistance (e.g., ceramic proppants retain >90% strength under 8,000 psi).
- Low conductivity loss (resin-coated proppants reduce embedment in shale by 40%).
- Customizable mesh sizes (ranging from 12/20 to 40/60 mesh for varying permeability needs).
Examples of Innovations:
- Bio-based proppants: Derived from agricultural waste (e.g., rice husks, corn stover), these materials offer biodegradability and reduced environmental persistence.
- Hollow ceramic spheres: Lightweight yet durable, these proppants improve fracture geometry by reducing proppant settling in vertical wells.
- Smart proppants: Embedded with sensors to monitor temperature, pressure, and fluid flow post-fracturing, enabling real-time diagnostics.
Real-Time Monitoring Systems: Fiber Optics and Microseismic Mapping
The integration of distributed acoustic sensing (DAS) and distributed temperature sensing (DTS) via fiber-optic cables has revolutionized well surveillance, allowing operators to visualize fracture propagation and fluid movement in real time. Coupled with microseismic mapping, these tools provide a 3D understanding of induced seismicity and fracture complexity, critical for optimizing stimulation designs.
Data-Driven Fracturing Benefits:
- Fracture mapping accuracy: DAS resolves microseismic events with <1 meter precision, reducing uncertainty in fracture half-length predictions.
- Fluid diversion optimization: Real-time pressure/temperature data adjusts pump rates dynamically to avoid screenouts or under-stimulation.
- Seismic risk mitigation: Microseismic clusters >ML 2.5 are flagged for immediate operational adjustments (e.g., reduced injection rates).
Case Study: Eagle Ford Shale
- Pre-innovation (2010–2014): Fracture models relied on post-stimulation pressure falloff tests, often missing >30% of fracture complexity.
- Post-innovation (2015–present): DAS-enabled designs increased effective stimulated rock volume (ESRV) by 25–40%, with a 15% reduction in water usage per well.
AI-Driven Fluid Optimization: Reducing Costs and Environmental Impact
Artificial intelligence and machine learning models now analyze vast datasets—including well logs, geological surveys, and historical production—to tailor fracturing fluids for specific formations. Generative design algorithms optimize fluid recipes by balancing viscosity, proppant suspension, and leakoff control, while reinforcement learning adjusts pump schedules dynamically based on real-time feedback.
AI Applications in Fracking Fluids:
- Fluid loss control: Predictive models reduce polymer usage by 20–30% by identifying optimal crosslinker concentrations.
- Proppant transport efficiency: Simulations minimize settling in high-viscosity fluids, improving placement in lateral wells.
- Water recycling: AI identifies contaminants in flowback, optimizing reuse cycles and reducing disposal costs.
Example: Halliburton’s FRACADE™ Platform
- Uses neural networks to correlate seismic attributes with production outcomes, reducing dry-hole risks by 18% in the Marcellus Shale.
- Automated fluid design: Cuts gel loading times by 40% through pre-optimized recipes for specific lithologies.
Comparison of Legacy vs. Modern Fracking Techniques
The following table contrasts traditional methods with contemporary advancements, focusing on efficiency, safety, and sustainability metrics. Data sources include SPE (Society of Petroleum Engineers) studies, EIA reports, and operator case studies (2018–2023).
| Metric |
Legacy Techniques (Pre-2010) |
Modern Techniques (2020–2024) |
Improvement (%) |
|---|
| Recovery Rate (EUR) |
100–300 bbls oil/well (Eagle Ford) |
500–1,200 bbls oil/well (with AI + horizontal drilling) |
+200–400% |
| Water Usage per Well |
3–5 million gallons (linear wells) |
0.5–2 million gallons (low-water fracturing + recycling) |
-60 to -90% |
| Casing Integrity Failures |
1 in 500 wells (API 2012) |
1 in 5,000+ wells (fiber-optic monitoring + cementing advancements) |
-98% |
| Proppant Efficiency |
50–60% embedment in shale |
10–20% embedment (ceramic/resin-coated proppants) |
+30–50% |
| Seismic Event Frequency (>ML 2.5) |
1 in 10 stages (Permian Basin) |
1 in 100+ stages (microseismic-guided adjustments) |
-90% |
Horizontal Drilling: Synergy with Hydraulic Fracturing
Horizontal drilling has become indispensable to fracking, enabling access to vast lateral sections of tight formations while maximizing contact with reservoir rock. Directional drilling tools, such as rotary steerable systems (RSS) and azimuthal gamma-ray sensors, allow precise wellbore trajectories, often deviating up to 10,000 feet laterally with <1° dogleg severity.
Key Enablers of Horizontal Fracking:
- Multi-stage fracturing: 15–30 discrete stages per lateral (vs. 3–5 in vertical wells), increasing surface area exposure by 5–10x.
- Lateral length optimization: AI models correlate wellbore length with production decline curves, targeting 5,000–12,000 ft laterals for economic viability.
- Trajectory control: Real-time adjustments via electromagnetic (EM) positioning reduce tortuosity, improving proppant distribution.
Synergy with Hydraulic Fracturing:
- Stress shadow mitigation: Horizontal wells exploit natural fracture networks, reducing the need for excessive hydraulic energy.
- Cluster efficiency: Stages are spaced 20–50 ft apart, with ball-sealers ensuring sequential fracturing without interference.
- Reservoir drainage: Laterals follow geosteering data to stay within sweet spots, improving recovery by 25–40% in shale plays.
Emerging "Green Fracking" Technologies
The push for sustainability has spurred innovations that minimize water usage, eliminate toxic additives, and reduce carbon footprints. Below are three promising approaches with demonstrated pilot-scale success.
-
Low-Water Fracturing (L
Fracking stands as a testament to humanity’s capacity to harness subterranean resources with unprecedented efficiency, yet its legacy remains mired in complex trade-offs between energy abundance and ecological preservation. As technological advancements—from AI-driven fluid optimization to low-water fracturing—continue to refine the process, the industry faces mounting pressure to reconcile productivity with sustainability. The path forward hinges on balancing economic imperatives with rigorous environmental stewardship, ensuring that innovation does not come at the expense of future generations’ access to clean water, stable climates, and resilient ecosystems. Whether viewed as a bridge to renewable energy or a self-sustaining powerhouse, fracking’s role in the global energy transition will ultimately be defined by its ability to evolve responsibly.
FAQ
Why is fracking called fracking?
Fracking is short for hydraulic fracturing, a process that involves injecting fluid into rock at high pressure to create fractures. The term "fracking" became widely used as shorthand in the media and public discourse, especially after the 2000s energy boom in the U.S. The word itself is derived from "fracture," with "ing" added to describe the action.
What is the purpose of fracking?
The purpose of fracking is to extract natural gas (mostly methane) or oil from deep underground rock formations, such as shale, that are not permeable enough for traditional drilling. By creating small fractures in the rock, it allows trapped hydrocarbons to flow more freely to wells. It has significantly increased access to previously uneconomical reserves, boosting energy production in countries like the U.S.
|
Leave a Comment
Comments are moderated before appearing. The data you submit is processed according to the Privacy Policy of Voltefac.