What To Evaluate Key Components Methods And Best Practices

Published

Table of Contents

Effective evaluation serves as the cornerstone of informed decision-making, enabling organizations to measure progress, refine strategies, and achieve sustainable outcomes. Whether assessing project performance, stakeholder satisfaction, or systemic impact, a structured evaluation framework ensures clarity, accountability, and continuous improvement. This guide explores the fundamental principles, tools, and ethical considerations that underpin rigorous evaluation processes, from defining core metrics to communicating insights with precision.

The discipline of evaluation transcends mere data collection—it demands a synthesis of quantitative rigor and qualitative insight to address complex challenges. By examining frameworks like Balanced Scorecard and OKRs, stakeholders can align evaluation criteria with strategic objectives while mitigating biases and ensuring transparency. From gap analyses to stakeholder workshops, each method contributes to a holistic understanding of performance, fostering adaptability in dynamic environments. The integration of advanced tools, such as sentiment analysis or ethnographic studies, further enhances evaluation accuracy, provided ethical guidelines and regulatory compliance are upheld.

what to evaluate

Core Components of Evaluation Frameworks and Structured Metric Categorization

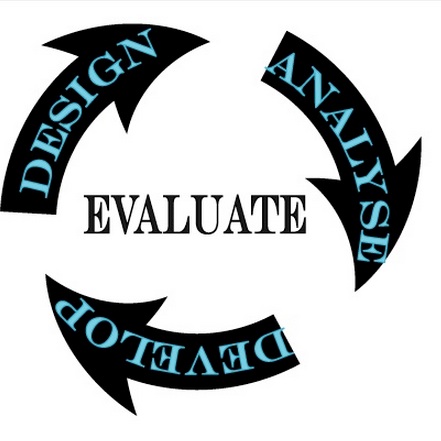
Evaluation frameworks serve as systematic methodologies to assess performance, impact, or progress against predefined objectives. Their effectiveness hinges on five interdependent components that ensure clarity, measurability, and alignment with strategic goals. These elements—objectives, indicators, data collection methods, analysis techniques, and reporting mechanisms—operate in a cyclical manner, where each informs and refines the others. For instance, poorly defined objectives may render indicators irrelevant, while inadequate data collection undermines the credibility of analysis. Below, these components are dissected to highlight their roles, interactions, and the foundational logic underpinning their application.

Five Essential Elements of Evaluation Frameworks

The five core components of any evaluation framework form a logical sequence that begins with strategic alignment and concludes with actionable insights. Their interplay ensures evaluations are both rigorous and adaptable to organizational or project-specific contexts.
"An evaluation framework is only as strong as its weakest link—each component must be deliberately designed to avoid systemic biases or gaps in measurement."
  1. Objectives
    Objectives define the purpose of the evaluation, translating high-level goals into specific, time-bound outcomes. They must adhere to the SMART criteria (Specific, Measurable, Achievable, Relevant, Time-bound) to ensure clarity. For example, a nonprofit evaluating a community health program might set an objective like "Reduce childhood malnutrition rates by 20% within 18 months in target districts." Objectives serve as the North Star for all subsequent evaluation activities, including indicator selection and data prioritization.
  2. Indicators
    Indicators are quantitative or qualitative variables that proxy progress toward objectives. They are derived directly from objectives and must be valid (measuring what they claim) and reliable (consistent over time). Indicators can be categorized as:
  3. Process indicators (e.g., number of workshops conducted),
  4. Output indicators (e.g., training manuals distributed),
  5. Outcome indicators (e.g., participant knowledge scores),
  6. Impact indicators (e.g., reduction in malnutrition rates).
  7. Poorly chosen indicators risk misdirection—for instance, tracking "participant satisfaction" without linking it to behavioral change may yield misleading results.
  8. Data Collection Methods
    The method of data collection determines the quality, granularity, and cost of evaluation findings. Common approaches include:
  9. Primary data: Surveys, interviews, or direct observations (e.g., household surveys for malnutrition rates).
  10. Secondary data: Existing datasets (e.g., government health records, NGO reports).
  11. Mixed methods: Combining quantitative surveys with qualitative interviews to triangulate results.
  12. Selection depends on feasibility, resource constraints, and the need for real-time vs. retrospective analysis. For instance, a tech startup evaluating user engagement might use A/B testing (primary) alongside Google Analytics (secondary).
  13. Analysis Techniques
    Analysis transforms raw data into actionable insights through statistical, thematic, or comparative methods. Techniques vary by indicator type:
  14. Quantitative analysis: Regression models, descriptive statistics (e.g., calculating malnutrition rate trends).
  15. Qualitative analysis: Thematic coding of interview transcripts (e.g., identifying barriers to program participation).
  16. Benchmarking: Comparing performance against industry standards or peer organizations.
  17. Advanced techniques like machine learning (for predictive analytics) or cost-benefit analysis (for resource allocation) are increasingly integrated into frameworks.
  18. Reporting Mechanisms
    Reporting ensures transparency, accountability, and decision-making. Effective reports include:
  19. Executive summaries for stakeholders,
  20. Visualizations (charts, dashboards) for trend analysis,
  21. Recommendations tied to specific objectives,
  22. Limitations to contextualize findings.
  23. Frameworks like the Logical Framework Approach (LFA) mandate structured reporting formats to align with donor or regulatory requirements. For example, a corporate sustainability report might use GRI standards to present environmental impact data.

Categorization of Evaluation Criteria: Quantitative vs. Qualitative Metrics

Evaluation criteria are systematically categorized to balance objectivity (quantitative) with contextual depth (qualitative). This dual approach mitigates the risk of over-reliance on one dimension, which can lead to skewed interpretations. Quantitative metrics provide scalability and comparability, while qualitative metrics capture nuanced human experiences and systemic factors.
"The most robust evaluations integrate both metrics—quantitative data answers 'how much?' qualitative data answers 'why?' and 'how?'."
  1. Quantitative Metrics
    These metrics are numerical, measurable, and often standardized, enabling statistical analysis. They are ideal for:
  2. Performance tracking (e.g., sales growth, website traffic),
  3. Efficiency assessments (e.g., cost per unit produced),
  4. Scalability evaluations (e.g., reach of a marketing campaign).
  5. Common sources include:
  6. Financial data (revenue, ROI),
  7. Operational data (productivity rates, error margins),
  8. Customer data (Net Promoter Score, conversion rates).
  9. Example: A retail chain evaluating store performance might use same-store sales growth (quantitative) to identify underperforming locations.
  10. Qualitative Metrics
    These metrics focus on subjective experiences, perceptions, and contextual factors that quantitative data cannot capture. They are essential for:
  11. Stakeholder feedback (e.g., employee morale, customer satisfaction narratives),
  12. Cultural or behavioral insights (e.g., reasons for program dropout),
  13. Thematic analysis (e.g., emerging trends in open-ended survey responses).
  14. Methods include:
  15. Interviews and focus groups,
  16. Content analysis (e.g., social media sentiment),
  17. Participant observation.
  18. Example: A university evaluating a new teaching methodology might use student essays (qualitative) to assess critical thinking improvements beyond test scores.
  19. Hybrid Approaches
    Many frameworks employ triangulation, combining both metrics to validate findings. For instance:
  20. Survey data (quantitative) + interview quotes (qualitative) to explain a drop in customer retention.
  21. Sales figures (quantitative) + market research insights (qualitative) to refine a product launch strategy.
  22. Tools like SWOT analysis or Balanced Scorecard explicitly integrate both dimensions to provide holistic evaluations.

Comparative Analysis of Three Widely Used Evaluation Frameworks

Evaluation frameworks are selected based on organizational goals, industry norms, and resource availability. Below is a comparative table outlining three frameworks—Balanced Scorecard (BSC), Objectives and Key Results (OKRs), and Key Performance Indicators (KPIs)—highlighting their principles, strengths, and ideal use cases.
Framework Key Principles Strengths Weaknesses Ideal Use Cases Example Organizations
Balanced Scorecard (BSC)
  • Aligns strategy with four perspectives: Financial, Customer, Internal Processes, Learning & Growth.
  • Uses lagging and leading indicators to balance short-term and long-term metrics.
  • Encourages cross-functional collaboration through cascaded objectives.
  • Holistic view of performance beyond financials.
  • Scalable for large organizations with complex hierarchies.
  • Linkage to strategic planning and resource allocation.
  • Can become overly bureaucratic if not simplified.
  • Requires significant initial setup and stakeholder buy-in.
  • Less agile for rapid pivoting (e.g., startups).
  • Corporate strategy execution (e.g., Fortune 500 companies).
  • Public sector performance management (e.g., government agencies).
  • Nonprofits tracking multi

    Methods for Assessing Performance and Outcomes

    Performance and outcome evaluation requires systematic methodologies to bridge the gap between current capabilities and predefined benchmarks. These methods ensure objective assessment, stakeholder alignment, and actionable insights. Below are structured approaches for gap analysis, qualitative peer review, 360-degree feedback systems, and weighted scoring matrices, each designed to enhance evaluative rigor and decision-making.

    Conducting a Gap Analysis Between Current Performance and Benchmarks

    Gap analysis identifies discrepancies between existing performance and aspirational targets, enabling targeted improvements. Tools like SWOT (Strengths, Weaknesses, Opportunities, Threats) and benchmarking provide frameworks for structured assessment.

    Procedural Steps for Gap Analysis
    To execute a gap analysis effectively, follow these steps:

    1. Define Benchmarks
    Establish clear, measurable benchmarks aligned with strategic objectives. These may include industry standards, competitor performance, or internal targets. For example, a healthcare organization might benchmark patient satisfaction scores against national averages.

    2. Collect Current Performance Data
    Gather quantitative and qualitative data on current performance. Metrics could include productivity rates, error frequencies, or employee engagement scores. Tools like Balanced Scorecards or Key Performance Indicators (KPIs) aid in data consolidation.

    3. Apply SWOT Analysis
    Use a SWOT matrix to categorize findings:

  • Strengths: Internal advantages (e.g., high employee retention).
  • Weaknesses: Internal deficiencies (e.g., outdated technology).
  • Opportunities: External factors to leverage (e.g., market demand for a service).
  • Threats: External challenges (e.g., regulatory changes).
  • SWOT Analysis Formula: Gap = (Desired Benchmark – Current Performance) × (Weighted Priority Factor) 4. Benchmarking Against Competitors or Standards
    Compare internal data with external benchmarks (e.g., ISO certifications, peer organizations). Tools like competitive intelligence reports or third-party audits provide comparative insights.

    5. Identify Root Causes
    Use fishbone diagrams (Ishikawa) or 5 Whys technique to trace gaps to underlying issues (e.g., lack of training, process inefficiencies).

    6. Develop an Action Plan
    Prioritize gaps based on impact and feasibility. Assign ownership, timelines, and resources. For instance, a retail chain might address a 20% lower sales conversion rate by retraining staff.

    Example Tools for Gap Analysis

  • SWOT Matrix: Visualizes internal/external factors.
  • Benchmarking Databases: Industry-specific (e.g., IBISWorld, Gartner).
  • Root Cause Analysis (RCA): Systematic problem-solving (e.g., 8D Methodology).
  • Structuring a Peer-Review Process for Qualitative Outcomes

    Peer review evaluates qualitative outcomes through structured feedback from subject-matter experts or colleagues. This method enhances credibility, identifies blind spots, and fosters collaborative improvement.

    Key Components of a Peer-Review Process
    1. Selecting Reviewers
    Choose reviewers based on expertise, objectivity, and relevance to the evaluated domain. For instance, a research paper might involve academic peers, while a marketing campaign could include industry professionals.

    2. Defining Evaluation Criteria
    Align criteria with project goals. Common frameworks include:

  • Rubrics: Scored scales (e.g., 1–5) for clarity, creativity, or feasibility.
  • Checklists: Binary compliance (e.g., "Does the report meet accessibility standards?").
  • 3. Participant Roles and Responsibilities

  • Reviewers: Provide constructive feedback using predefined templates.
  • Authors/Subjects: Address feedback and justify decisions where necessary.
  • Facilitator: Manages timelines, resolves conflicts, and ensures anonymity if required.
  • 4. Feedback Templates
    Use standardized templates to ensure consistency. Example sections:

  • Strengths: Highlighted achievements.
  • Areas for Improvement: Specific, actionable suggestions.
  • Overall Rating: Holistic assessment (e.g., "Excellent," "Needs Revision").
  • Peer-Review Feedback Template Structure:

    [Reviewer Name] | [Date]
    1. Clarity of Objectives: [Score: 1–5] | Comments: ______
    2. Methodological Rigor: [Score: 1–5] | Comments: ______
    3. Originality/Innovation: [Score: 1–5] | Comments: ______
    5. Anonymization Protocols
    Protect reviewer and author identities to encourage candid feedback. Tools like blinded peer review (used in academic journals) or digital platforms (e.g., Google Forms with anonymized responses) ensure confidentiality.

    6. Iterative Feedback Loops
    Allow multiple rounds of review for complex projects. Document changes made in response to feedback to demonstrate progress.

    Example Applications

  • Academic Research: Journal submissions (e.g., Nature’s double-blind review).
  • Creative Industries: Film festivals or design competitions with juried feedback.
  • Corporate Initiatives: Cross-departmental reviews of internal reports.
  • Implementing a 360-Degree Feedback System

    A 360-degree feedback system collects multi-source input (e.g., managers, peers, subordinates, self-assessments) to provide a holistic view of performance. This method reduces bias and fosters continuous development.

    Step-by-Step Implementation Guide
    1. Define Objectives
    Clarify the purpose (e.g., leadership development, team cohesion). Align with organizational goals, such as improving communication or identifying training needs.

    2. Select Participants
    Include:

  • Direct Reports: Subordinates’ perspectives on leadership.
  • Peers: Lateral relationships (e.g., collaboration skills).
  • Managers: Supervisory feedback.
  • Self-Assessment: Individual reflections on strengths/weaknesses.
  • External Stakeholders: Clients or partners (if applicable).
  • 3. Choose Data Collection Methods

  • Surveys: Structured questionnaires (e.g., Likert scales for agreement levels).
  • Example: "Rate your manager’s ability to delegate tasks (1–5)."
  • Interviews: In-depth discussions for qualitative insights.
  • Observations: Direct assessments of behaviors (e.g., meeting dynamics).
  • Document Analysis: Reviewing past performance records (e.g., emails, project deliverables).
  • 4. Design the Feedback Instrument
    Use a balanced mix of:

  • Behavioral Competencies: Skills like "adaptability" or "decision-making."
  • Core Values: Alignment with organizational culture (e.g., "integrity").
  • Open-Ended Questions: Qualitative input (e.g., "Describe a time your teamwork improved a project outcome.").
  • 5. Ensure Anonymization
    Implement protocols to protect identities:

  • Digital Tools: Platforms like TalentLMS or BambooHR with anonymized response options.
  • Physical Surveys: Sealed envelopes or third-party collection.
  • Anonymization Best Practices:
  • Use unique, non-traceable IDs for respondents.
  • Store data on encrypted servers.
  • Restrict access to aggregated results only.
  • 6. Compile and Analyze Data
  • Quantitative Analysis: Calculate averages/percentiles for each competency.
  • Qualitative Analysis: Thematic coding of open-ended responses (e.g., using NVivo software).
  • Benchmarking: Compare results against team/departmental averages.
  • 7. Provide Actionable Feedback

  • Individual Reports: Tailored insights with specific examples.
  • Development Plans: SMART goals (Specific, Measurable, Achievable, Relevant, Time-bound).
  • Group Workshops: Facilitate discussions on collective improvements.
  • Example 360-Degree Feedback Metrics

    CategorySample QuestionScoring Scale
    Leadership"Inspires and motivates the team."1–5
    Communication"Clearly articulates ideas during meetings."1–5
    Innovation"Encourages creative problem-solving."1–5
    Self-Assessment"Identify one skill you’d like to improve."Open-ended
    Case Study: 360-Degree Feedback in Healthcare
    A hospital implemented a 360-degree system for nurses, collecting feedback from patients, colleagues, and supervisors. Results revealed gaps in patient communication, leading to targeted training programs that improved satisfaction scores by 22% within six months (source: Journal of Nursing Administration, 2021).

    Creating a Weighted Scoring Matrix for Evaluation Criteria

    A weighted scoring matrix prioritizes evaluation criteria based on stakeholder

    what to evaluate - Ilustrasi 2

    Advanced Tools and Techniques for Data Collection in Evaluation Frameworks

    Data collection serves as the foundation of rigorous evaluation, determining the validity, reliability, and actionability of insights. Advanced tools and techniques enable evaluators to capture nuanced, high-fidelity data while addressing the complexities of modern evaluation environments—such as scalability, real-time analysis, and cross-disciplinary integration. This section examines five high-impact tools, contrasts structured and unstructured data sources, and provides a template for harmonizing mixed-methods approaches to ensure robust evaluation outcomes.

    Five Advanced Data Collection Tools and Their Technical Requirements

    The selection of data collection tools depends on evaluation objectives, resource constraints, and the nature of the data required. Below are five sophisticated tools, their technical prerequisites, and inherent limitations, categorized by their primary application in evaluation contexts.

    Context for Selection
    Evaluators must align tool capabilities with evaluation goals—whether measuring behavioral shifts (A/B testing), emotional responses (sentiment analysis), or contextual dynamics (ethnographic studies). Each tool introduces trade-offs between granularity, cost, and implementation complexity.

    • A/B Testing Platforms (e.g., Optimizely, Google Optimize)

      Technical Requirements: Integration with web/mobile applications via SDKs or JavaScript snippets; requires statistical significance thresholds (e.g., 95% confidence, p < 0.05); sample size calculators for power analysis. Compatible with CRM or analytics tools (e.g., Google Analytics, Mixpanel) for cross-referencing user segments.

      Applications in Evaluation: Measures incremental changes in user behavior (e.g., click-through rates, conversion paths) to assess intervention efficacy. Ideal for digital product evaluations or marketing campaigns.

      Limitations:

      • Limited to measurable, discrete outcomes; unable to capture qualitative rationale behind user decisions.
      • Ethical concerns with randomized control groups in high-stakes interventions (e.g., healthcare, education).
      • Requires continuous monitoring to avoid "test fatigue" or skewed results from external variables (e.g., seasonal trends).

    • Natural Language Processing (NLP) for Sentiment Analysis (e.g., IBM Watson, MonkeyLearn)

      Technical Requirements: Access to text data (e.g., surveys, social media, call transcripts); pre-processing (tokenization, lemmatization); trained models (rule-based or machine learning, e.g., VADER, BERT). Cloud-based APIs may incur costs based on volume and complexity.

      Applications in Evaluation: Quantifies emotional tone (positive/negative/neutral) in open-ended feedback or unstructured data to gauge stakeholder satisfaction, brand perception, or program impact.

      Limitations:

      • Contextual ambiguity in sarcasm, idioms, or domain-specific jargon reduces accuracy (e.g., "great" in customer service vs. product reviews).
      • Bias in training datasets (e.g., over-representation of Western English) may skew results for global evaluations.
      • Requires human validation for high-stakes decisions (e.g., regulatory compliance evaluations).

    • Ethnographic Studies (Digital and In-Person)

      Technical Requirements: For digital ethnography—participant consent platforms (e.g., UserTesting), screen recording tools (e.g., Zoom, Loom), or passive data capture (e.g., session replay via Hotjar). In-person studies require audio/video equipment (e.g., Sony PMZ-500), transcription services (e.g., Otter.ai), and fieldnote templates. Ethical review boards may mandate additional safeguards (e.g., anonymization protocols).

      Applications in Evaluation: Reveals latent user needs, cultural norms, or workflow disruptions through immersive observation. Critical for UX research, policy evaluations, or community-based interventions.

      Limitations:

      • High resource intensity (time, personnel) limits scalability; sample sizes are typically small (n < 50).
      • Observer bias and reactivity (Hawthorne effect) may distort natural behaviors.
      • Data triangulation required to validate findings (e.g., combining with surveys or logs).

    • IoT and Wearable Sensor Data (e.g., Fitbit, Zephyr Bioharness)

      Technical Requirements: Device compatibility with evaluation platforms (e.g., API integration via AWS IoT Core); data encryption for HIPAA/GDPR compliance; real-time processing pipelines (e.g., Apache Kafka). Requires expertise in signal processing for artifact removal (e.g., motion noise in ECG data).

      Applications in Evaluation: Tracks physiological responses (e.g., heart rate variability, stress levels) or environmental interactions (e.g., air quality in workplace evaluations) to assess physical well-being or ergonomic interventions.

      Limitations:

      • Privacy concerns and participant burden (e.g., discomfort with continuous monitoring).
      • Data sparsity or missing values due to sensor malfunctions or non-compliance.
      • High initial costs for equipment and maintenance; limited accessibility in low-resource settings.

    • Geospatial and Remote Sensing Tools (e.g., QGIS, ArcGIS, Sentinel Hub)

      Technical Requirements: Access to satellite imagery (e.g., Landsat, Sentinel-2) or geotagged data (e.g., OpenStreetMap); programming skills (Python/R with libraries like `geopandas`, `rasterio`); cloud storage for large datasets (e.g., Google Earth Engine). Requires GIS expertise for spatial analysis (e.g., kernel density estimation, hotspot analysis).

      Applications in Evaluation: Maps resource distribution (e.g., healthcare facilities), tracks land-use changes for environmental impact assessments, or correlates spatial data with social outcomes (e.g., poverty rates).

      Limitations:

      • Temporal resolution gaps (e.g., cloud cover in satellite imagery) may require supplementary data.
      • Ethical risks in using geospatial data for surveillance or exclusionary policies (e.g., redlining).
      • Data integration challenges with non-spatial datasets (e.g., aligning census data with satellite layers).

    Comparative Analysis: Structured vs. Unstructured Data Sources and Their Impact on Evaluation Accuracy

    The choice between structured (e.g., databases, closed-ended surveys) and unstructured (e.g., social media, open-ended responses) data sources fundamentally influences evaluation rigor, generalizability, and actionability. Below is a comparative framework highlighting their strengths, weaknesses, and ideal use cases.

    Context for Comparison
    Structured data excels in scalability and statistical analysis, while unstructured data provides depth and contextual richness. The synergy between both—when intentionally combined—enables triangulation and mitigates biases inherent in single-source evaluations.

    Dimension Structured Data Sources Unstructured Data Sources
    Data Characteristics
    • Predefined formats (e.g., SQL tables, CSV files, Likert scales).
    • Low variability; amenable to statistical modeling (e.g., regression, ANOVA).
    • Examples: CRM databases, standardized surveys (e.g., PIRLS, PISA), transaction logs.
    • Variable formats (text, images, audio, video); high dimensionality.
    • Requires NLP, computer vision, or manual coding for analysis.
    • Examples: Customer reviews, focus group transcripts, social media posts, ethnographic fieldnotes.
    Strengths in Evaluation
    • High reliability and reproducibility; enables large-scale hypothesis testing.
    • Cost-effective for longitudinal tracking (e.g., program participation rates).
    • Supports causal inference with experimental designs (e.g., RCT protocols).
    • Stakeholder Engagement in Evaluation Processes

      Stakeholder engagement is a cornerstone of credible and impactful evaluations, ensuring that diverse perspectives are integrated into the design, execution, and utilization of evaluation frameworks. Effective engagement fosters trust, enhances relevance, and improves the adoption of evaluation findings. This section explores systematic approaches to mapping stakeholder influence, facilitating collaborative workshops, structuring engagement timelines, and upholding ethical standards in stakeholder interactions.

      Mapping Stakeholder Influence and Interest Levels

      A structured method for categorizing stakeholders based on their power (ability to influence decisions) and interest (level of concern or involvement) enables tailored communication strategies. The power-interest grid (adapted from Mendelow’s model) provides a visual framework to prioritize engagement efforts. Below is a tabular representation with stakeholder types, recommended engagement approaches, and communication channels:
      Stakeholder Type Power Level Interest Level Engagement Strategy Recommended Communication Channels
      Key Players High High Direct involvement in design; regular updates; decision-making roles. Face-to-face meetings, dedicated stakeholder forums, formal reports.
      Context Setters High Low Informational updates; minimal consultation unless issues arise. Email newsletters, annual briefings, public summaries.
      Subject Matter Experts Low High Consultative input; technical advisory roles; feedback loops. Workshops, focus groups, online surveys, webinars.
      Marginal Stakeholders Low Low General awareness; minimal interaction unless relevant. Public announcements, social media, periodic bulletins.
      Key Considerations:
    • Power is assessed based on authority, resources, or control over evaluation outcomes (e.g., funders, policymakers).
    • Interest reflects stakeholder motivation, such as personal impact, professional relevance, or advocacy goals.
    • Dynamic Adjustments: Stakeholder positions may shift over time (e.g., a low-interest group may become critical during implementation). Reassess the grid at evaluation milestones.
    • Facilitating Stakeholder Workshops for Co-Designing Evaluation Criteria

      Workshops provide a collaborative space to align stakeholders on evaluation objectives, metrics, and methodologies. A structured approach ensures inclusivity, minimizes dominance by vocal participants, and achieves consensus. The process includes preparation, execution, and follow-through, with specific techniques to enhance participation.

      Pre-Workshop Preparation:

    • Objective Clarity: Define the workshop’s purpose (e.g., "Align on 3 key evaluation criteria for program X").
    • Stakeholder Selection: Use the power-interest grid to invite representatives from each quadrant.
    • Logistics: Schedule for 2–4 hours; ensure accessibility (virtual/physical); prepare materials (agenda, flip charts, digital tools like Miro or Mentimeter).
    • Icebreaker Activities: Use interactive exercises to build rapport and reduce hierarchy:
    • Two Truths and a Lie (Evaluation Edition): Participants share two true facts and one false statement about their experience with past evaluations. The group guesses the lie.
    • Evaluation Bingo: Create bingo cards with terms (e.g., "KPI," "baseline," "stakeholder"). Participants mark terms heard during introductions.
    • Word Cloud: Ask stakeholders to contribute 1–2 words describing their hopes for the evaluation. Display results to identify common themes.
    • Consensus-Building Techniques:

    • World Café Method: Divide participants into small groups rotating through discussion stations (e.g., "What metrics matter most?"). Each group summarizes insights for the next.
    • Dot Voting: Present a list of proposed criteria (e.g., "Impact on beneficiaries," "Cost-efficiency"). Participants vote with sticky dots; top-voted items are prioritized.
    • Affinity Mapping: Groups cluster related ideas (e.g., "Transparency," "Data accuracy," "Community feedback") into thematic categories. Visualize connections to identify overarching themes.
    • Delphi Technique: Anonymous, iterative feedback rounds where stakeholders rank or refine criteria until consensus emerges (useful for contentious topics).
    • Post-Workshop Actions:

    • Documentation: Capture decisions, action items, and unresolved issues in a shared document (e.g., Google Docs).
    • Follow-Up: Assign owners to pending tasks (e.g., "Draft a survey based on workshop criteria by [date]") and share a summary report within 48 hours.
    • Developing a Stakeholder Engagement Plan with Clear Milestones

      A phased engagement plan ensures sustained interaction and addresses stakeholders’ evolving needs. Milestones should align with the evaluation lifecycle—preparation, implementation, and utilization—while accommodating feedback loops. Below is a template for a structured plan:
      Phase Milestone Activities Stakeholders Involved Outputs Timeline
      Pre-Evaluation Stakeholder Mapping Conduct power-interest analysis; identify key informants. Evaluation team, senior management. Power-interest grid, stakeholder registry. Week 1–2
      Briefing Session Present evaluation scope, methods, and expected outcomes; gather initial feedback. All stakeholders (prioritizing Key Players and Subject Matter Experts). Briefing report, feedback summary. Week 3
      Implementation Mid-Point Check-In Review progress; adjust criteria or methods based on emerging issues. Key Players, Subject Matter Experts. Adjustment memo, revised timeline. Midway through evaluation.
      Focus Group Sessions Conduct themed discussions (e.g., "Data reliability," "Ethical concerns"). Context Setters, Subject Matter Experts. Transcripts, thematic analysis. Weeks 6–8
      Draft Findings Review Share preliminary results; solicit validation or corrections. All stakeholders. Annotated draft report. Week 10
      Post-Evaluation Debrief Workshop Discuss findings, lessons learned, and next steps for utilization. All stakeholders. Debrief report, utilization plan. Week 12
      Utilization Plan Finalization Agree on how findings will inform decisions (e.g., policy changes, program adjustments). Key Players, policymakers. Actionable utilization plan. Week 14
      Best Practices for Milestone Execution:
    • Transparency: Share agendas, meeting notes, and drafts in advance to allow preparation.
    • Flexibility: Allocate buffer time for unexpected stakeholder priorities (e.g., "If 30% of Key Players request a delay, adjust the timeline").
    • Documentation: Maintain an engagement log to track participation, feedback, and decisions.
    • Feedback Loops: After each milestone, conduct a 5
    • Visualizing and Communicating Evaluation Results

      Effective communication of evaluation findings ensures that stakeholders—regardless of technical expertise—can grasp insights, make data-driven decisions, and align actions with strategic goals. Visualization transforms raw data into intuitive narratives, while structured reporting and presentation techniques enhance clarity, engagement, and trust in evaluation outcomes. This section focuses on designing accessible dashboards, crafting compelling infographics, structuring narrative reports, and delivering results through presentations, with an emphasis on sensitivity, transparency, and stakeholder alignment.

      Designing an Executive Summary Dashboard for Non-Technical Audiences

      A well-designed dashboard synthesizes key metrics, trends, and qualitative insights into a single, actionable view. For non-technical audiences, simplicity, hierarchy, and visual contrast are critical. Below is a template description (ASCII art representation) followed by implementation guidelines.

      Dashboard Template Structure (ASCII Representation):

      +-----------------------------------------------------+
      | [Organization Logo] |
      | [Evaluation Title: Bold, Large Font] |
      | [Date: Subtle, Small Font] |
      +-----------------------------------------------------+
      | [Section 1: Key Findings (Top-Level Metrics)] |
      | - [Icon: 📈] Performance Trend (Line Chart) |
      | - [Icon: 🏆] Top Achievements (Bullet Points) |
      | - [Icon: ⚠️] Critical Gaps (Highlighted Bar) |
      +-----------------------------------------------------+
      | [Section 2: Stakeholder-Specific Insights] |
      | - [Tab: "Program Managers"] |
      | - [Metric: 💰 Budget Utilization (Pie Chart)] |
      | - [Quote: "82% of funds allocated to..."] |
      | - [Tab: "Policy Makers"] |
      | - [Metric: 📊 Policy Impact (Heatmap)] |
      | - [Note: "Recommendation: Prioritize..."] |
      +-----------------------------------------------------+
      | [Section 3: Actionable Recommendations] |
      | - [Icon: 🎯] Strategic Priorities (Numbered List) |
      | - [Icon: 📅] Timeline for Implementation |
      +-----------------------------------------------------+
      | [Footer: Contact/Feedback] |
      +-----------------------------------------------------+

      Implementation Guidelines:

    • Hierarchy: Use size, color, and placement to prioritize information. Place the most critical metric (e.g., overall success rate) at the top-left corner of the dashboard.
    • Icons and Symbols: Leverage universally recognizable symbols (e.g., 📈 for trends, ⚠️ for risks) to reduce cognitive load.
    • Color Psychology:
    • Green: Success, progress (e.g., "90% target achieved").
    • Red/Orange: Alerts or underperformance (e.g., "30% shortfall in Module X").
    • Blue: Neutral or informational (e.g., "Baseline data").
    • Avoid red-green colorblindness conflicts by using patterns or additional symbols.
    • Interactivity (if digital): Allow users to toggle between stakeholder views (e.g., "Program Managers" vs. "Donors") via tabs or dropdowns.
    • Mobile Responsiveness: Ensure text and charts scale without losing readability on smaller screens.
    • Example Use Case:
      A healthcare evaluation dashboard for a non-profit might include:

    • Section 1: "Vaccination Coverage: 78% (vs. 85% target)" with a rising trend line.
    • Section 2 (Policy Makers Tab): A heatmap showing regional disparities in access.
    • Section 3: "Recommendation: Expand outreach in Urban Zone B by Q3 2024."
    • Step-by-Step Guide for Creating Infographics to Present Complex Evaluation Data

      Infographics distill complex data into visual stories, making them ideal for reports, presentations, or social media. The process involves data simplification, visual hierarchy, and psychological triggers to guide attention. Below is a structured approach with emphasis on design principles.

      Step 1: Define the Purpose and Audience

    • Align the infographic with a specific goal (e.g., "Explain program reach to donors" or "Highlight gaps for internal teams").
    • Tailor content to the audience’s prior knowledge. For example:
    • Executives: Focus on high-level trends and ROI.
    • Field Staff: Include operational details (e.g., "3 clinics added in Region Y").
    • Step 2: Select and Simplify Data

    • Quantitative Data: Choose 3–5 key metrics (e.g., "Participation Rate," "Cost per Beneficiary"). Use aggregated data to avoid clutter.
    • Qualitative Data: Convert insights into quotations, icons, or short narratives. Example:
    • ❝"Community feedback indicated transportation as the primary barrier."❞
    • Avoid: Overloading with raw numbers or dense text blocks.
    • Step 3: Choose a Visual Framework
      Select a layout template based on the data type:

    • Timeline: For process evaluations (e.g., "Program Phases and Milestones").
    • Comparison: For benchmarking (e.g., "Before/After Intervention").
    • Hierarchy: For priorities (e.g., "Top 3 Challenges by Frequency").
    • Geospatial: For regional evaluations (e.g., "Service Coverage Map").
    • Step 4: Apply Color Psychology and Hierarchy

    • Color Roles:
    • Primary Color: Dominant theme (e.g., brand color for consistency).
    • Secondary Colors: Differentiate categories (e.g., blue for "Success," yellow for "Needs Improvement").
    • Accent Colors: Highlight critical data points (e.g., red for "Budget Overrun").
    • Hierarchy Techniques:
    • Size: Larger icons/metrics for priority items.
    • Placement: Top-left for the most important element (Western reading patterns).
    • Contrast: Bold borders or shadows for key data.
    • Step 5: Incorporate Visual Metaphors and Icons

    • Use icons to replace text where possible (e.g., 👥 for "Participants," 💰 for "Funding").
    • Metaphors: Simplify abstract concepts. Example:
    • A thermometer to show "Progress Toward Goal" (0% to 100%).
    • A puzzle piece to represent "Integration Challenges."
    • Step 6: Add Narrative Flow with Annotations

    • Callouts: Direct attention to insights (e.g., "↑ 20% increase in Q2 due to...").
    • Arrows: Guide the viewer’s eye through a logical sequence.
    • Minimal Text: Use bullet points or short phrases (max 5–7 words per label).
    • Step 7: Test for Clarity and Accessibility

    • Cognitive Load Check: Can a viewer understand the main message in <10 seconds?
    • Accessibility:
    • Ensure contrast ratios meet WCAG standards (e.g., dark text on light backgrounds).
    • Provide alt-text for icons in digital formats.
    • Avoid chartjunk (e.g., unnecessary 3D effects, gridlines).
    • Feedback Loop: Pilot the infographic with a representative stakeholder and refine based on their confusion points.
    • Example Infographic: Program Impact

      [Title: "How Our Literacy Program Transformed Communities"]
      [Left Side: Bar Chart] "Reading Proficiency: Before vs. After"

    • 2019: 35% (gray bar)
    • 2023: 72% (blue bar, highlighted)
    • [Right Side: Icons + Quotes]
    • 👩🏫 Teacher: "Students now ask for books at home!"
    • 📚 Book Icon: "3,000+ new titles distributed"
    • ⚠️ Challenge: "Urban schools lag due to facility constraints"
    • [Bottom: CTA] "Download Full Report →"

      Structuring a Narrative Report Combining Quantitative and Qualitative Insights

      A narrative report bridges data and context, making findings memorable and actionable. The structure should balance evidence-based rigor with storytelling to engage diverse stakeholders. Below is a heading-based template with content guidelines for each section.

      Report Outline with Content Guidelines

      what to evaluate - Ilustrasi 3

      1. Executive Summary

      Purpose: Provide a concise overview (1 page max) for busy readers. Include:
    • 1–2 sentence context: "This evaluation assessed the [Program Name]’s impact on [specific outcome] over [timeframe] in [location], funded by [source]."
    • Top-Level Findings: Use bullet points for 3–5 key results. Example:
    • "Achieved 89% of the target enrollment, exceeding projections by 15%."
    • "Qual
    • Ethical and Practical Considerations in Evaluation

      Ethical and practical considerations form the bedrock of credible, responsible, and impactful evaluations. Evaluations often navigate complex moral dilemmas, regulatory constraints, and resource limitations, requiring evaluators to balance transparency, fairness, and compliance. This section examines six ethical dilemmas, procedural safeguards for data protection, feasibility assessment frameworks, and the integration of sustainability criteria into evaluation designs. The discussion emphasizes structured approaches to mitigate risks while upholding professional integrity and stakeholder trust.

      Common Ethical Dilemmas in Evaluations and Resolution Frameworks

      Evaluations frequently encounter ethical conflicts that challenge objectivity, confidentiality, and equity. Below are six recurring dilemmas, each accompanied by a resolution framework grounded in ethical guidelines (e.g., American Evaluation Association’s Guiding Principles, OECD Due Diligence Framework).

      Conflict of Interest
      Evaluators may face situations where personal, financial, or professional relationships with stakeholders compromise impartiality. For example, an evaluator employed by a nonprofit may assess its own program, risking bias in findings.
      Resolution Framework:

    • Disclosure: Mandate pre-evaluation declarations of potential conflicts, including affiliations, funding sources, or prior relationships with stakeholders.
    • Independent Review: Engage an external ethics board or third-party auditor to validate the evaluation design and findings.
    • Blinded Analysis: Where feasible, anonymize data or delegate sensitive analyses to neutral parties.
    • Transparency Reporting: Disclose conflicts in the evaluation report, acknowledging limitations while maintaining methodological rigor.
    • Data Privacy vs. Public Accountability
      Sensitive participant data (e.g., health records, financial disclosures) may conflict with demands for transparency or regulatory reporting requirements.
      Resolution Framework:

    • Anonymization Protocols: Apply statistical techniques (e.g., differential privacy, k-anonymity) to aggregate data while preserving utility.
    • Consent Hierarchies: Implement tiered consent models (e.g., broad consent for public reporting, granular consent for individual-level data sharing).
    • Legal Safeguards: Consult data protection officers to align with laws like GDPR (Article 6–9) or HIPAA (Privacy Rule), ensuring anonymized datasets are exempt from disclosure obligations.
    • Ethics Approval: Obtain institutional review board (IRB) or ethics committee approval before collecting or disseminating sensitive data.
    • Stakeholder Coercion
      Power imbalances (e.g., funders pressuring evaluators, beneficiaries fearing retribution) may distort evaluation processes or outcomes.
      Resolution Framework:

    • Participatory Safeguards: Embed stakeholder forums where marginalized groups can voice concerns without hierarchical interference.
    • Contractual Protections: Include clauses in evaluation agreements prohibiting retaliation against participants or evaluators for whistleblowing.
    • Exit Strategies: Provide anonymous feedback channels (e.g., digital dropboxes, third-party hotlines) for stakeholders to report coercion.
    • Triangulation: Cross-verify findings using multiple data sources (e.g., interviews, documents, observations) to counteract biased inputs.
    • Resource Allocation Dilemmas
      Limited budgets may force evaluators to prioritize speed over depth, risking superficial or incomplete assessments.
      Resolution Framework:

    • Prioritization Matrices: Use cost-benefit analyses to justify trade-offs (e.g., sampling strategies, reduced sample sizes) while documenting assumptions.
    • Phased Evaluations: Design modular assessments with incremental deliverables, allowing stakeholders to fund critical phases first.
    • Open-Source Tools: Leverage free or low-cost platforms (e.g., KoboToolbox for surveys, OpenDataKit for mobile data) to reduce expenses.
    • Transparency in Limitations: Clearly state constraints in the methodology section, framing them as deliberate choices rather than oversights.
    • Cultural Sensitivity and Appropriateness
      Evaluations in diverse contexts may inadvertently impose Westernized frameworks or overlook local norms, leading to misinterpretations or harm.
      Resolution Framework:

    • Cultural Audits: Conduct preliminary research to identify taboos, communication styles, and power dynamics in the target community.
    • Local Partnerships: Collaborate with indigenous evaluators or cultural consultants to co-design tools and interpret results.
    • Adaptive Methodologies: Use participatory approaches (e.g., photovoice, storytelling) that align with oral traditions or non-literate contexts.
    • Contextual Validation: Pilot evaluation instruments with a small subgroup to test for cultural bias before full-scale deployment.
    • Whistleblowing and Harm Disclosure
      Evaluators may uncover unethical practices (e.g., fraud, human rights violations) during data collection but face dilemmas about disclosure.
      Resolution Framework:

    • Duty of Care: Adhere to professional codes (e.g., AAAE’s Principle of Public Regard) that prioritize protecting vulnerable populations over confidentiality.
    • Escalation Protocols: Establish clear channels to report harm to relevant authorities (e.g., UN mechanisms, national ombudsmen) while documenting steps taken.
    • Legal Counsel: Consult legal experts to assess risks of liability (e.g., defamation claims) before publicizing findings.
    • Restorative Approaches: Where possible, facilitate mediation between stakeholders to address harm without escalating conflicts.
    • Procedural Steps for Compliance with Data Protection Regulations

      Data protection laws (e.g., GDPR in the EU, HIPAA in the U.S., PIPEDA in Canada) impose strict obligations on evaluators handling personal data. Non-compliance risks legal sanctions, reputational damage, and loss of stakeholder trust. The following steps ensure adherence to regulatory frameworks during data collection, storage, and dissemination.

      1. Pre-Evaluation Legal Review
      Conduct a Data Protection Impact Assessment (DPIA) to identify risks and determine if the evaluation triggers regulatory thresholds (e.g., processing "special category" data like health or ethnic origin under GDPR).

    • Key Actions:
    • Map data flows (e.g., who collects, stores, or accesses data).
    • Consult legal counsel to interpret jurisdiction-specific laws (e.g., GDPR’s Article 35 requires DPIAs for high-risk processing).
    • Document legal bases for processing (e.g., consent, public task, legitimate interest) in compliance registers.
    • 2. Informed Consent and Transparency
      Obtain freely given, specific, informed consent from participants, detailing:

    • Purpose of data collection (avoid vague language).
    • Data retention periods and deletion policies.
    • Rights to access, rectify, or erase data (GDPR Article 15–22).
    • Third-party sharing (if applicable) and opt-out options.
    • Best Practice: Use plain-language consent forms with visual aids (e.g., icons for data types) and offer multilingual versions where needed.
    • 3. Data Minimization and Storage
      Adopt privacy-by-design principles to limit data collection to what is strictly necessary.

    • Technical Measures:
    • Encrypt data at rest and in transit (e.g., AES-256 encryption for databases).
    • Use role-based access controls (RBAC) to restrict data access to authorized personnel only.
    • Store data in secure, geographically limited servers (e.g., EU-hosted servers for GDPR compliance).
    • Physical Safeguards:
    • Secure storage for paper records (e.g., locked cabinets, shredding policies).
    • Biometric or token-based access for sensitive areas.
    • 4. Anonymization and Pseudonymization
      Apply techniques to prevent re-identification of individuals:

    • Anonymization: Irreversible removal of identifiers (e.g., replacing names with codes).
    • Pseudonymization: Reversible encoding (e.g., hashing emails) with a separate key stored securely.
    • Validation: Use tools like k-anonymity or l-diversity to test for residual risks.
    • Example: For a health evaluation, replace participant IDs with tokens (e.g., "P-2024-001") and store the mapping in a separate, access-restricted database.
    • 5. Data Retention and Deletion
      Establish automated retention schedules aligned with legal requirements:

    • GDPR: Data must be retained no longer than necessary; explicit deletion policies are mandatory.
    • HIPAA: Retention periods vary by state (e.g., 6 years for most records in California).
    • Procedures:
    • Implement "right to erasure" (GDPR Article 17) processes with audit trails.
    • Use software flags to auto-delete data after predefined periods (e.g., 3 years post-evaluation).
    • Conduct periodic data purges, documenting actions in compliance logs.
    • 6. Cross-Border Data Transfers
      If data is transferred outside the evaluator’s jurisdiction (e.g., cloud storage in the U.S. for a European project), ensure compliance with:

    • GDPR: Adequacy decisions (e.g., EU-U.S. Data Privacy Framework) or Standard Contractual Clauses (SCCs) approved by the European Commission.
    • HIPAA: Business Associate Agreements (BAAs) with third-party vendors.
    • Actions:
    • Obtain participant consent for transfers where required.
    • Conduct transfer impact assessments (TIAs) for high-risk scenarios.
    • Restrict access to transferred data via technical

      Mastering the art of evaluation is not merely about gathering data but about transforming insights into actionable strategies that drive meaningful change. By systematically categorizing metrics, engaging stakeholders collaboratively, and visualizing results with clarity, evaluators can bridge gaps between aspirations and achievements. The frameworks, tools, and ethical principles outlined here provide a roadmap for organizations seeking to elevate their evaluation practices—ensuring that every assessment contributes to long-term success. As industries evolve, the ability to evaluate with precision will remain a defining factor in achieving impactful and sustainable outcomes.

    • FAQ

      What specific signs and symptoms should you evaluate to recognize septic shock in a patient?

      Evaluate for hypotension (systolic BP <90 mmHg or >40 mmHg drop), lactate levels >2 mmol/L, oliguria (<0.5 mL/kg/h urine output), altered mental status, and hyperlactatemia alongside fever/chills, tachycardia, and signs of infection (e.g., wound redness, positive cultures). Rapid assessment of perfusion (capillary refill, skin mottling) and organ dysfunction (e.g., low urine output, confusion) is critical. Septic shock requires vasopressors (e.g., norepinephrine) to maintain BP and source control of infection.

      What blood tests should you get to evaluate thyroid function?

      The primary tests are TSH (thyroid-stimulating hormone), free T4 (thyroxine), and free T3 (triiodothyronine). TSH alone often suffices for hypothyroidism/hyperthyroidism, but free T4/T3 clarify central thyroid dysfunction or resistance. Thyroid antibodies (TPO, TgAb) help diagnose Hashimoto’s or Graves’ disease. Additional tests like total T3/T4 or thyroglobulin may be needed for specific conditions (e.g., thyroiditis, cancer).

      What tests are used to diagnose or evaluate diabetes?

      Key tests include HbA1c (≥6.5% confirms diabetes), fasting plasma glucose (≥126 mg/dL), or 2-hour oral glucose tolerance test (≥200 mg/dL). Random glucose ≥200 mg/dL with symptoms (e.g., polyuria, unexplained weight loss) also diagnoses diabetes. Autoantibodies (GAD65, IA-2, ZnT8) may identify type 1 diabetes, while lipid panel, kidney function (creatinine, eGFR), and urine albumin assess complications.

      What lab tests evaluate kidney function?

      Core tests are serum creatinine (evaluates glomerular filtration rate via eGFR formula) and blood urea nitrogen (BUN) (though less specific). Urine albumin-to-creatinine ratio (UACR) detects early kidney damage (e.g., diabetic nephropathy), while urinalysis checks for blood, protein, or casts. Advanced tests like cystatin C or kidney biopsy may be needed for precise diagnosis in complex cases.

      What blood tests should you get to evaluate PCOS (polycystic ovary syndrome)?

      Initial tests include luteinizing hormone (LH) and follicle-stimulating hormone (FSH) (elevated LH:FSH ratio is common), testosterone (total/free) and androgen panel (DHEAS, SHBG) to assess hyperandrogenism, and prolactin (to rule out hyperprolactinemia). Insulin/glucose tests (fasting insulin, HbA1c) evaluate metabolic dysfunction, while pelvic ultrasound confirms polycystic ovaries (rotterdam criteria). Thyroid panel (TSH, free T4) rules out thyroid disorders mimicking PCOS.

      What tests determine if someone has insulin resistance?

      Fasting insulin ≥15–20 µU/mL (with normal glucose) suggests resistance; HOMA-IR score (fasting glucose × insulin / 405) quantifies it (>2.5–3.0 is abnormal). Oral glucose tolerance test (OGTT) with insulin levels at 2 hours helps, while HbA1c and fasting glucose screen for prediabetes/diabetes linked to resistance. Triglycerides/HDL ratio (elevated) and waist circumference (central obesity) support the diagnosis. Euglycemic clamp (gold standard) is rarely used clinically.

      Leave a Comment

      Comments are moderated before appearing. The data you submit is processed according to the Privacy Policy of Voltefac.