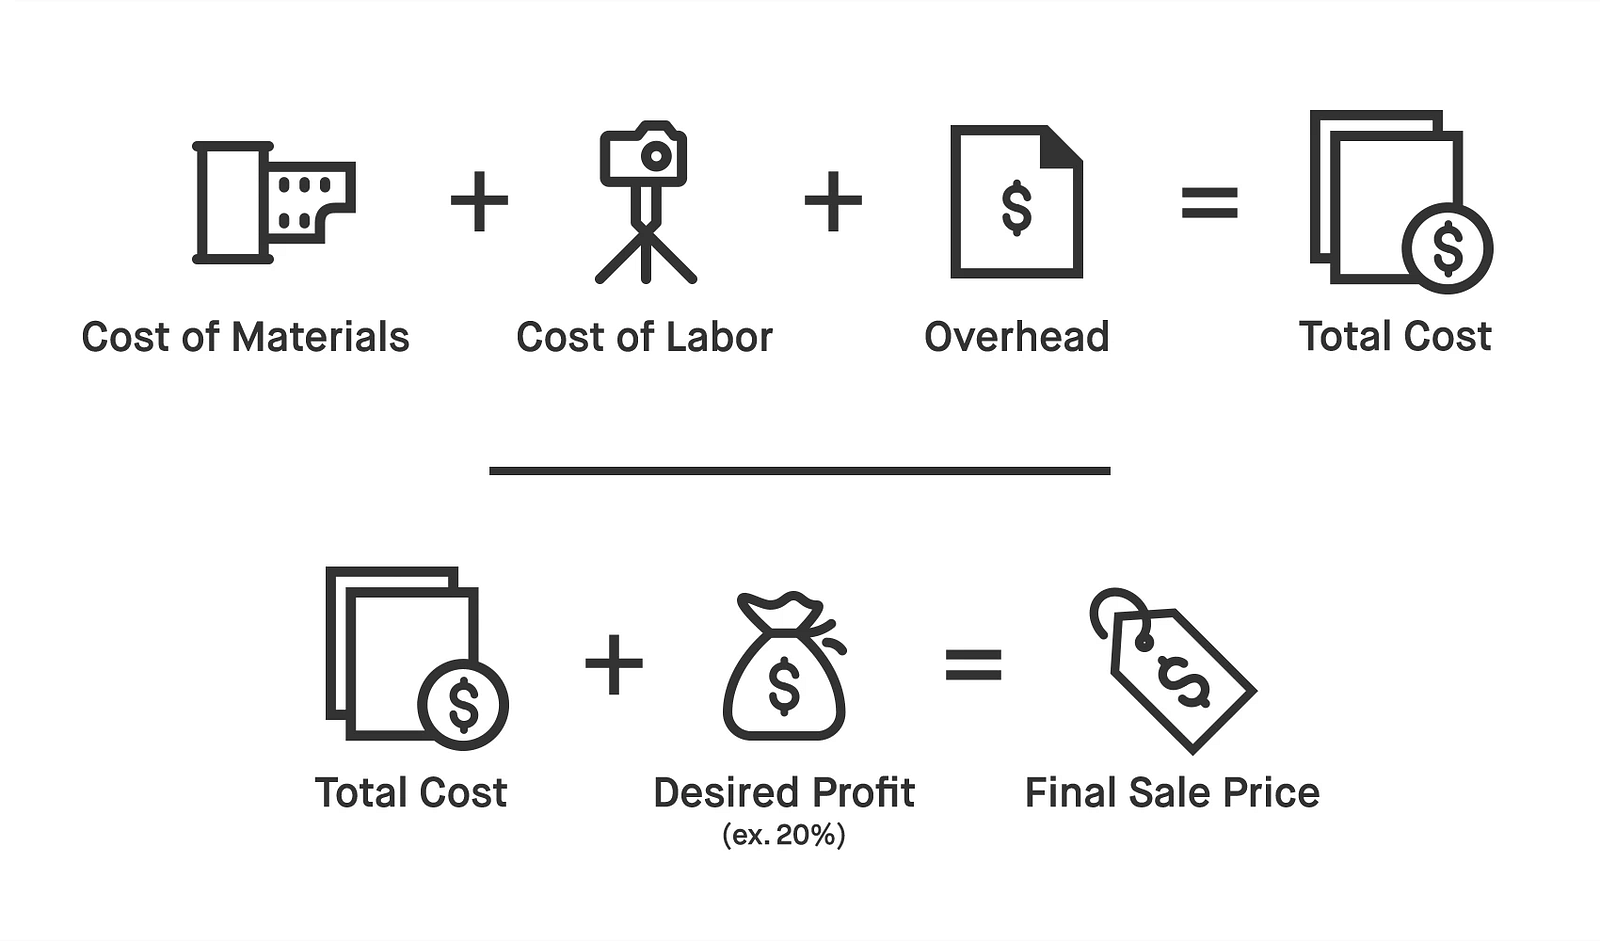
What Is Cost Benefit Analysis Explained Clearly And Practically

Published

Table of Contents

Cost-benefit analysis (CBA) serves as a cornerstone of evidence-based decision-making, offering a structured framework to weigh the financial and non-financial implications of projects, policies, or investments. By systematically quantifying costs and benefits—whether tangible (e.g., revenue, expenses) or intangible (e.g., public health, environmental impact)—CBA transforms complex evaluations into actionable insights. This methodology bridges the gap between theoretical assessment and real-world execution, ensuring that choices are not only data-driven but also aligned with long-term sustainability and stakeholder interests. From infrastructure megaprojects to corporate expansions, CBA provides a disciplined approach to mitigate risks and maximize value, even in the face of uncertainty.

The discipline’s rigor lies in its ability to demystify subjective trade-offs, replacing intuition with measurable outcomes. For instance, while a government may intuitively favor a new highway for economic growth, CBA quantifies its true cost—such as displaced communities or increased traffic congestion—against alternatives like public transit expansions. Similarly, private sector decisions, from mergers to R&D investments, leverage CBA to justify expenditures by projecting future returns with statistical precision. By integrating economic theory with practical tools like discounting and sensitivity analysis, CBA adapts to diverse contexts, from healthcare cost-containment strategies to climate resilience initiatives. Its versatility makes it indispensable in an era where decisions must balance efficiency, equity, and ethical accountability.

what is cost benefit analysis

Definition and Core Purpose of Cost-Benefit Analysis

Cost-benefit analysis (CBA) is a systematic framework used to evaluate the desirability of a project, policy, or investment by quantifying its economic impacts in monetary or non-monetary terms. Its core purpose lies in providing decision-makers with an objective basis to assess whether the expected benefits of an action outweigh its associated costs. Unlike subjective judgments, CBA transforms qualitative considerations—such as social welfare, environmental sustainability, or public health—into comparable metrics, enabling evidence-based prioritization. This method is particularly valuable in sectors where long-term consequences (e.g., infrastructure development, regulatory reforms) are uncertain or complex.

The analysis hinges on two fundamental components: costs and benefits, which are measured over a defined time horizon. Costs include direct expenditures (e.g., construction costs, operational expenses) and indirect costs (e.g., opportunity costs, externalities like pollution). Benefits encompass tangible gains (e.g., increased productivity, reduced healthcare expenses) and intangible advantages (e.g., improved quality of life, cultural preservation). The interaction between these components is captured through a net present value (NPV) calculation, where benefits are discounted to their present value to account for the time value of money. If NPV is positive, the project is deemed economically viable; otherwise, it may be reconsidered or rejected.

Structured Breakdown of Costs and Benefits

Costs and benefits in CBA are categorized based on their scope, timing, and measurability. Costs are typically classified into:
  • Direct costs: Immediate financial outlays, such as capital investments (e.g., building a dam) or recurring expenses (e.g., maintenance contracts).
  • Indirect costs: Secondary impacts, including lost productivity (e.g., traffic disruptions during construction) or environmental degradation (e.g., habitat destruction).
  • Opportunity costs: The value of the next best alternative foregone (e.g., investing in healthcare instead of education).
  • External costs: Societal burdens not borne by the decision-maker (e.g., carbon emissions leading to climate change).
  • Benefits, conversely, are segmented into:

  • Private benefits: Direct gains to stakeholders (e.g., higher profits for a company adopting a new technology).
  • Social benefits: Wider societal advantages (e.g., reduced traffic fatalities from a new road network).
  • Non-market benefits: Values not traded in markets (e.g., aesthetic improvements in a park, measured via contingent valuation techniques).
  • Future benefits: Long-term advantages (e.g., renewable energy projects reducing future fuel costs), adjusted for discount rates to reflect uncertainty and inflation.
  • Key Formula:
    Net Present Value (NPV) = Σ (Benefitst / (1 + r)t) – Σ (Costst / (1 + r)t)
    Where:
  • t = time period,
  • r = discount rate (reflecting risk and opportunity cost of capital).
  • The challenge in CBA lies in accurately monetizing non-market benefits, which often requires creative valuation methods (e.g., hedonic pricing for environmental impacts, willingness-to-pay surveys). For instance, assigning a monetary value to a reduced risk of asthma from cleaner air involves estimating the cost of medical treatments or lost workdays, while cultural heritage preservation might rely on hypothetical willingness-to-pay scenarios.
    While CBA focuses on comprehensive economic evaluation, other financial tools address narrower or distinct objectives. The following table contrasts CBA with three commonly used alternatives:
    Tool Name Primary Focus Key Strengths Common Use Cases
    Cost-Benefit Analysis (CBA) Monetizing all costs and benefits (direct, indirect, social) to determine net economic value.
    • Holistic assessment of societal impacts.
    • Supports policy decisions with quantifiable trade-offs.
    • Adaptable to both market and non-market values.
    • Public infrastructure (e.g., high-speed rail projects).
    • Environmental regulations (e.g., carbon tax evaluations).
    • Healthcare interventions (e.g., vaccination programs).
    Cost-Effectiveness Analysis (CEA) Comparing costs of alternative interventions to achieve a specific health or social outcome (e.g., cost per disability-adjusted life year averted).
    • Useful when benefits are difficult to monetize (e.g., public health).
    • Simpler than CBA for comparative efficiency.
    • Focuses on incremental improvements.
    • Pharmaceutical pricing (e.g., cost per life saved by a drug).
    • Education policies (e.g., cost per student achieving proficiency).
    • Disaster preparedness (e.g., cost per life protected by early warning systems).
    Return on Investment (ROI) Measuring profitability as a percentage return relative to capital invested, typically for private-sector projects.
    • Directly tied to shareholder value and financial performance.
    • Easy to compute and interpret for internal decision-making.
    • Ignores externalities and social costs.
    • Corporate investments (e.g., expanding production capacity).
    • Marketing campaigns (e.g., ROI of digital ads).
    • Real estate ventures (e.g., rental yield calculations).
    Cost-Utility Analysis (CUA) Extending CEA by incorporating quality-adjusted life years (QALYs) to weigh health outcomes against costs.
    • Accounts for both quantity and quality of life.
    • Preferred in healthcare for resource allocation.
    • Requires utility weights for health states.
    • Medical technology assessments (e.g., comparing dialysis machines).
    • Long-term care policies (e.g., assisted living programs).
    • Palliative care interventions.
    The choice between these tools depends on the decision context. For instance, a public-sector bridge construction project would use CBA to weigh traffic benefits against environmental costs, while a private hospital might prefer CUA to justify purchasing a new MRI machine based on QALYs saved. ROI, however, would be irrelevant for a policy aiming to reduce air pollution, as it fails to capture non-market benefits like improved public health.

    Distinguishing CBA from Intuitive or Emotional Decision-Making

    Intuitive or emotionally driven decisions often prioritize short-term gains, personal biases, or visible outcomes while disregarding hidden costs or long-term consequences. CBA mitigates these pitfalls by introducing structural rigor and transparency. For example:
  • Infrastructure Projects: A politician might advocate for a new stadium based on its symbolic value or campaign promises, ignoring the opportunity cost of diverting funds from education or healthcare. A CBA would quantify job creation against the lost tax revenue from underfunded schools, revealing a net negative impact over 20 years.
  • Policy Changes: A government may ban a chemical pesticide due to public outrage over health risks, without evaluating whether the economic losses to farmers (e.g., crop failures) outweigh the benefits. CBA would compare the cost of alternative pesticides, farmer subsidies, and healthcare savings from reduced exposure, potentially identifying a less disruptive regulatory approach.
  • Environmental Regulations: A city might ban single-use plastics to align with global sustainability trends, but a CBA could reveal that the cost of enforcing the ban (e.g., increased waste management fees) exceeds the environmental benefits (e.g., reduced marine pollution) in the short term. This insight might lead to phased implementation or targeted interventions (e.g., banning only the most harmful plastics).
  • Real-world failures highlight the dangers of ignoring CBA principles. The Big Dig project in Boston, with an estimated $14.8 billion cost overrun

    Key Steps and Methodology in Cost-Benefit Analysis

    Cost-Benefit Analysis (CBA) is a structured decision-making framework that evaluates the economic viability of projects, policies, or investments by comparing quantifiable costs and benefits. The methodology ensures that decisions account for both tangible and intangible factors, incorporating time-value adjustments and uncertainty assessments. Below is a systematic breakdown of the sequential steps, including data collection, valuation of non-monetary impacts, and financial metrics to derive actionable insights.

    Sequential Steps in Conducting a Cost-Benefit Analysis

    The CBA process follows a logical progression to ensure comprehensive evaluation. Each step builds on the previous one, requiring meticulous data collection, rigorous quantification, and sensitivity testing to validate results.

    1. Project Definition and Scope Establishment
    Before data collection, the project’s objectives, boundaries, and stakeholders must be clearly defined. This includes identifying the baseline (current state) and alternative scenarios (e.g., "do nothing" vs. proposed intervention). For example, a renewable energy project may compare solar panel installation against continued reliance on fossil fuels, with scope limited to a 20-year operational horizon.

    2. Identification of Costs and Benefits
    Costs and benefits are categorized into:

  • Direct costs: Expenditures directly tied to the project (e.g., construction, labor, equipment).
  • Indirect costs: Secondary expenses (e.g., regulatory compliance, opportunity costs).
  • Tangible benefits: Quantifiable outcomes (e.g., increased revenue, reduced operational costs).
  • Intangible benefits: Non-monetary impacts (e.g., improved public health, cultural heritage preservation).
  • A table below illustrates how costs and benefits are systematically identified for a hypothetical urban green space project:

    Category Examples Measurement Unit
    Direct Costs Land acquisition, landscaping, maintenance contracts USD (annualized)
    Indirect Costs Traffic disruption during construction, reduced property values nearby USD (estimated impact)
    Tangible Benefits Increased property values, reduced cooling costs for nearby buildings USD (annual savings)
    Intangible Benefits Improved mental health, reduced air pollution, enhanced biodiversity Monetized via valuation techniques (e.g., willingness-to-pay studies)
    3. Data Collection and Baseline Establishment
    Primary and secondary data sources are used to populate the CBA. Primary data includes surveys (e.g., contingent valuation for intangibles), while secondary data may come from government reports, industry benchmarks, or historical financial records. For instance, collecting air quality data before and after a smog-reducing policy implementation provides a baseline for quantifying health benefits.

    4. Quantification of Costs and Benefits
    Costs are typically straightforward to quantify using financial records. Benefits, however, often require conversion into monetary terms. Common techniques include:

  • Market pricing: Using existing market values (e.g., cost of medical treatment averted by a clean water project).
  • Hedonic pricing: Estimating non-market values (e.g., how much homeowners pay more for homes near parks).
  • Contingent valuation: Survey-based methods to elicit willingness-to-pay for public goods (e.g., preserving a national forest).
  • Revealed preference: Observing behavioral choices (e.g., travel time savings from a new transit line).
  • Example: Monetizing Environmental Benefits
    A coal plant retirement project may yield the following intangible benefits, quantified as follows:

  • Reduced premature deaths: Estimated at 50 lives saved annually, valued at $9.1 million/year (using the Value of Statistical Life, VSL, at $182,000 per life, per EPA guidelines).
  • Avoided healthcare costs: Reduced respiratory illnesses valued at $2.3 million/year (based on medical cost data from the CDC).
  • Ecosystem services: Carbon sequestration valued at $1.2 million/year (using social cost of carbon, $42/ton).
  • Assigning Monetary Values to Non-Monetary Benefits

    Non-monetary benefits—such as environmental quality, social equity, or cultural heritage—require specialized valuation techniques to integrate them into CBA. Below is a step-by-step procedure for assigning monetary values, using a renewable energy microgrid project as an example.

    Step-by-Step Procedure
    1. Select Valuation Method Based on Benefit Type

  • Use market-based methods (e.g., avoided cost, hedonic pricing) for benefits with observable market proxies.
  • Use stated preference methods (e.g., contingent valuation, choice modeling) for public goods lacking markets.
  • Use cost-based approaches (e.g., replacement cost, travel cost method) for ecosystem services.
  • 2. Gather Empirical Data

  • For health benefits from reduced pollution, use epidemiological studies linking exposure to mortality/morbidity rates (e.g., WHO’s air quality guidelines).
  • For recreation benefits, conduct travel cost surveys to estimate demand for access to natural areas.
  • 3. Apply Valuation Formulas

  • Willingness-to-Pay (WTP) for Clean Air:
  • Survey 500 residents to determine how much they would pay annually for a 10% reduction in PM2.5 levels. If the mean WTP is $50/person, and 20,000 residents are affected, the total annual benefit is $1 million.
  • Avoided Cost of Illness:
  • Multiply the number of cases averted (e.g., 300 asthma cases) by the average cost per case ($1,500), yielding $450,000/year.

    4. Adjust for Uncertainty and Distribution

  • Use confidence intervals from survey data to account for variability in WTP.
  • Apply equity weights if benefits disproportionately affect low-income groups (e.g., doubling the value of health benefits for vulnerable populations).
  • 5. Document Assumptions and Limitations

  • Clearly state assumptions (e.g., "WTP assumes no free alternatives exist").
  • Acknowledge limitations (e.g., hypothetical bias in contingent valuation).
  • Example: Valuing Biodiversity in a Wetland Restoration Project

  • Method: Travel Cost Method (TCM) for recreation + Hedonic Pricing for property values.
  • Data:
  • 1,000 visitors/year, with average travel cost of $20/visit → $20,000/year in recreation value.
  • Homes near restored wetlands increase in value by 1.5% → $500,000/year for 50 properties.
  • Total Monetized Benefit: $520,000/year.
  • Discounting Future Values and Financial Metrics

    Costs and benefits occurring over time must be adjusted to present value (PV) to account for the time value of money. Discounting ensures comparability across time periods, typically using a social discount rate (e.g., 3–7% for public projects, as recommended by the U.S. Office of Management and Budget).

    Key Concepts

  • Net Present Value (NPV): The difference between the PV of benefits and costs over the project’s lifetime.
  • NPV = Σ [Benefitst / (1 + r)t] – Σ [Costst / (1 + r)t]
    Where:
    r = discount rate
    t = time period
  • Benefit-Cost Ratio (BCR): The ratio of PV benefits to PV costs. A BCR > 1 indicates net benefits.
  • BCR = PV(Benefits) / PV(Costs)
  • Internal Rate of Return (IRR): The discount rate at which NPV = 0. Used to compare projects with similar lifespans.
  • Example: Discounting a 10-Year Solar Farm Project

    YearBenefit (USD)Cost (USD)PV(Benefit) @5%PV(Cost) @5%
    005,000,00005,000,000
    1800,000

    what is cost benefit analysis - Ilustrasi 2

    Applications Across Industries

    Cost-Benefit Analysis (CBA) serves as a versatile tool for decision-making across diverse sectors, where it quantifies the economic, social, and environmental impacts of policies, projects, or investments. Its adaptability stems from its ability to integrate qualitative and quantitative factors, making it indispensable in both public and private domains. While foundational principles remain consistent, the application of CBA varies significantly depending on industry-specific challenges, stakeholder priorities, and regulatory frameworks. This section explores five critical sectors where CBA is frequently deployed, contrasts its use in public versus private sectors, and examines sector-specific challenges alongside mitigation strategies. Additionally, it assesses how emerging trends—such as artificial intelligence and climate change—are reshaping the scope and methodologies of modern CBA evaluations.

    Five Key Sectors and Industry-Specific Use Cases

    CBA is widely adopted in sectors where decisions involve substantial resource allocation, long-term consequences, or competing stakeholder interests. The following examples illustrate its practical applications, highlighting how each sector tailors CBA to address unique objectives.

    Healthcare
    In healthcare, CBA evaluates the economic feasibility of medical interventions, public health programs, and infrastructure investments. For instance, the World Health Organization (WHO) uses CBA to assess the cost-effectiveness of vaccination campaigns, such as the HPV vaccine, by comparing the financial burden of implementation against long-term healthcare savings from reduced cervical cancer cases. Similarly, hospital expansions or telemedicine adoption are analyzed using CBA to determine whether the upfront costs justify improvements in patient outcomes, operational efficiency, or accessibility. A notable case is the UK’s National Health Service (NHS), which employs CBA to prioritize drug approvals under its Nice (National Institute for Health and Care Excellence) framework, ensuring that treatments with high clinical benefits also deliver value for money.

    Transportation and Infrastructure
    Transportation projects, such as highways, public transit systems, and airports, rely heavily on CBA to justify funding and mitigate disruptions. The U.S. Federal Highway Administration uses CBA to evaluate road expansions, weighing construction costs against benefits like reduced travel time, accident prevention, and economic growth in adjacent areas. For example, the California High-Speed Rail project underwent extensive CBA to assess whether its projected $100 billion cost would yield sufficient societal benefits, including job creation and reduced greenhouse gas emissions. In contrast, urban transit systems (e.g., subway networks) are analyzed for their impact on congestion, air quality, and property values, often incorporating value of time saved and non-market benefits like improved public health.

    Technology and Digital Innovation
    Private technology firms and governments use CBA to assess the viability of digital transformations, such as cloud migration, AI integration, or cybersecurity investments. For example, Microsoft’s Azure cloud services underwent CBA to determine the optimal pricing model, balancing customer acquisition costs against projected revenue growth and operational savings. In public sector applications, e-governance initiatives (e.g., Estonia’s digital identity system) are evaluated using CBA to measure efficiency gains, reduced corruption, and citizen convenience against implementation expenses. Additionally, AI-driven healthcare diagnostics are scrutinized for their cost-benefit trade-offs, where the upfront costs of training models are weighed against potential reductions in misdiagnosis and treatment expenses.

    Energy and Climate Policy
    The energy sector employs CBA to guide investments in renewable energy, fossil fuel phase-outs, and carbon pricing mechanisms. The International Energy Agency (IEA) uses CBA to compare the costs of solar, wind, and nuclear power against their environmental benefits, such as avoided carbon emissions. A prominent example is the European Union’s Green Deal, where CBA informed policies like the Emissions Trading System (ETS), balancing economic costs for industries against climate mitigation goals. Similarly, battery storage projects are evaluated for their ability to stabilize grid reliability and reduce energy costs over time.

    Education and Human Development
    Educational policies and infrastructure projects frequently utilize CBA to allocate scarce resources efficiently. For instance, school construction programs in developing countries (e.g., UNICEF’s initiatives) apply CBA to determine whether building new schools yields higher long-term benefits—such as increased workforce productivity and reduced poverty—compared to alternative investments like vocational training. In higher education, online learning platforms (e.g., Coursera or edX) are assessed for their cost-effectiveness in expanding access to education while maintaining quality. Additionally, early childhood education programs are evaluated for their return on investment, with studies (e.g., Heckman Equation) demonstrating that interventions like Head Start in the U.S. generate significant economic returns through improved earnings and reduced crime rates over a lifetime.

    Public vs. Private Sector Adaptations of Cost-Benefit Analysis

    While CBA follows a common framework, its implementation diverges between public and private sectors due to differing objectives, discount rates, and stakeholder considerations. Public sector CBAs prioritize social welfare, equity, and long-term sustainability, often incorporating non-market values (e.g., environmental quality, public health). In contrast, private sector CBAs focus on shareholder value, risk-adjusted returns, and competitive advantage, with a stronger emphasis on internal rates of return (IRR) and net present value (NPV).

    Public Sector Applications
    Government decisions, such as subsidies, public infrastructure, and regulatory policies, rely on CBA to justify expenditures that may not yield direct private returns. For example:

  • Government Subsidies for Renewable Energy: The U.S. Production Tax Credit (PTC) for wind energy was evaluated using CBA to determine whether the subsidy’s cost ($24 billion over a decade) outweighed benefits like job creation and reduced carbon emissions. The analysis incorporated social cost of carbon estimates to quantify environmental externalities.
  • Disaster Preparedness: Post-Hurricane Katrina, the U.S. government conducted CBA to assess the cost-effectiveness of levee systems in New Orleans, balancing construction expenses against potential losses from future flooding. The analysis included probabilistic risk assessments to account for uncertainty in climate models.
  • Private Sector Applications
    Corporate decisions, such as mergers, R&D investments, and supply chain optimizations, use CBA to maximize profitability while managing risks. Key examples include:

  • Corporate Mergers and Acquisitions: When Pfizer acquired Medivation (2016) for $14 billion, CBA was employed to evaluate whether the acquisition’s upfront cost justified the expected revenue growth from Xtandi, a prostate cancer drug. The analysis considered synergy benefits, market expansion, and regulatory risks.
  • Automated Manufacturing: Companies like Tesla use CBA to determine whether investing in robotics and AI for production lines reduces long-term labor costs and improves efficiency. The evaluation includes learning curves, maintenance costs, and productivity gains over time.
  • Key Differences in Approach

    Public Sector CBA:
  • Discount Rate: Often uses social discount rates (e.g., 3–5%) to reflect societal time preferences and long-term horizons.
  • Benefit Measurement: Incorporates non-market values (e.g., biodiversity, reduced traffic fatalities) via contingent valuation or hedonic pricing.
  • Uncertainty Handling: Employs sensitivity analysis and distribution-based approaches (e.g., Monte Carlo simulations) to account for political and economic volatility.
  • Equity Considerations: Applies cost-effectiveness analysis (CEA) or equity-weighted CBAs to ensure fair distribution of benefits (e.g., targeting subsidies to low-income households).
  • Private Sector CBA:

  • Discount Rate: Typically uses WACC (Weighted Average Cost of Capital) or opportunity cost of capital (e.g., 8–12%) to reflect investor expectations.
  • Benefit Measurement: Focuses on direct financial returns (e.g., revenue growth, cost savings) and tangible assets (e.g., patented technologies).
  • Uncertainty Handling: Relies on real options analysis and scenario planning to address market risks.
  • Stakeholder Priorities: Aligns with shareholder value maximization, often excluding externalities unless legally required (e.g., ESG reporting).
  • Sector-Specific Challenges and Mitigation Strategies

    Each industry faces unique challenges in conducting CBA, ranging from data scarcity to political interference. The following table outlines sector-specific obstacles and corresponding mitigation strategies, ensuring robustness in evaluations.
    Sector Key Challenges Mitigation Strategies Examples of Implementation
    Healthcare Data Availability and Quality
    • Leverage healthcare databases (e

      Common Pitfalls and Ethical Considerations in Cost-Benefit Analysis

      Cost-benefit analysis (CBA) is a rigorous tool for decision-making, yet its effectiveness hinges on methodological precision and ethical integrity. Missteps in execution—such as incomplete cost accounting or biased valuation—can distort outcomes, leading to suboptimal or unjust decisions. Ethical lapses, such as excluding vulnerable groups or manipulating discount rates, further erode trust and undermine public welfare. This section examines five critical pitfalls in CBA, their real-world consequences, and a structured approach to ethical compliance. A checklist of dilemmas and a bias-detection framework are provided to guide practitioners toward transparency and fairness.

      Five Common Pitfalls in Cost-Benefit Analysis and Their Consequences

      Errors in CBA often stem from oversights, cognitive biases, or deliberate misrepresentations. The following pitfalls are recurrent in practice, with case studies illustrating their impact on policy, infrastructure, and corporate decisions.
      1. Ignoring Opportunity Costs
        Opportunity costs—the value of foregone alternatives—are frequently omitted or underestimated in CBA, particularly in public sector projects. This oversight leads to decisions that appear cost-effective but divert resources from higher-value uses.
        Example: The Three Gorges Dam project in China initially excluded opportunity costs of displaced communities and lost agricultural land. Post-construction analyses revealed that the dam’s benefits were overstated by ~$10 billion due to unaccounted social and environmental trade-offs (World Bank, 2010).
        Consequence: Resource misallocation, reduced long-term economic efficiency, and social unrest.
      2. Overestimating Benefits or Underestimating Costs
        Optimism bias and political pressure often inflate projected benefits (e.g., job creation, GDP growth) while downplaying risks (e.g., maintenance costs, environmental damage). This is particularly common in infrastructure and megaprojects.
        Example: The London Heathrow Airport Expansion (2012) projected 74,000 new jobs and £72 billion in economic benefits. Independent reviews later revealed that only 10% of jobs were sustainable, and noise pollution costs exceeded £1.6 billion annually (UK Parliament, 2018).
        Consequence: Budget overruns, stranded assets, and reputational damage for stakeholders.
      3. Improper Discount Rate Application
        Discount rates convert future costs/benefits to present value, but arbitrary or politically motivated rates distort intergenerational equity. High rates favor short-term gains, while low rates may justify unsustainable long-term liabilities.
        Example: The UK’s Trident Nuclear Submarine Program (2016) used a 3.5% discount rate (below the Treasury’s standard 3.5–7% range) to justify a £31 billion expenditure. Critics argued this rate inflated present-value benefits by ~20%, prioritizing defense over healthcare or education (House of Commons, 2017).
        Consequence: Misaligned priorities, intergenerational unfairness, and fiscal strain.
      4. Exclusion of Non-Market Values
        Environmental, cultural, or health impacts lacking market prices (e.g., biodiversity loss, indigenous land rights) are often excluded, leading to "greenwashing" of projects.
        Example: The Xayaburi Dam in Laos (2012) underwent CBA that assigned zero value to Mekong River fisheries, which provided livelihoods for 60 million people. Post-dam studies found fish populations dropped by 90%, displacing 4,000 households (IUCN, 2016).
        Consequence: Irreversible ecological harm, social conflict, and legal challenges (e.g., lawsuits from NGOs).
      5. Data Manipulation or Selective Analysis
        Cherry-picking favorable scenarios, suppressing dissenting views, or using flawed data sources undermines credibility. This is prevalent in corporate and government CBAs where transparency is low.
        Example: Enron’s Dabhol Power Project (2001) in India used inflated demand forecasts and excluded fuel price risks in its CBA. When global oil prices surged, the project’s costs ballooned by $4.5 billion, leading to its abandonment and Enron’s bankruptcy (US SEC, 2002).
        Consequence: Financial collapse, regulatory penalties, and erosion of public trust.

      Ethical Dilemmas in Cost-Benefit Analysis and Mitigation Frameworks

      Ethical concerns in CBA arise from conflicts between efficiency, equity, and accountability. Below is a checklist of dilemmas, categorized by stakeholder impact, followed by frameworks to address them.
      1. Bias in Discount Rates
        Dilemma: Using low rates to favor present generations over future ones (e.g., climate change mitigation) or high rates to deprioritize long-term social goods.
        Framework: Adopt intergenerational equity principles (e.g., Stern Review’s 1.4% rate for climate policy) and disclose sensitivity analyses for ±2% rate variations.
      2. Exclusion of Marginalized Groups
        Dilemma: CBAs often overlook impacts on low-income, minority, or indigenous populations due to data gaps or deliberate omission.
        Framework: Apply participatory CBA (e.g., Social Return on Investment (SROI)) and use disaggregated impact assessments (e.g., by gender, ethnicity).
      3. Corporate Capture of Public CBAs
        Dilemma: Private sector influence skews analyses toward profit maximization (e.g., pharmaceutical pricing, fossil fuel subsidies).
        Framework: Enforce independent review panels (e.g., OECD’s CBA Guidelines) and mandate public disclosure of stakeholder funding.
      4. Normalization of Irreversible Costs
        Dilemma: Assigning zero or low value to irreversible harms (e.g., species extinction, cultural heritage loss) to justify development.
        Framework: Use precautionary principles and non-monetary valuation (e.g., contingent valuation for ecosystem services).
      5. Short-Termism in Political CBAs
        Dilemma: Elective cycles prioritize visible short-term benefits over long-term sustainability (e.g., infrastructure vs. education).
        Framework: Implement multi-period CBAs (e.g., 20–50 year horizons) and independent fiscal councils to audit political CBAs.

      Flowchart: Detecting and Correcting Bias in Cost-Benefit Analysis Methodologies

      Bias in CBA often stems from methodological assumptions, data selection, or stakeholder exclusion. The following step-by-step flowchart helps identify and rectify biases systematically.

      1. Define Scope and Stakeholders

    • List all affected parties (direct/indirect, present/future).
    • Red Flag: Exclusion of marginalized groups or long-term actors (e.g., future generations).
    • 2. Review Discount Rate Justification

    • Compare against standard benchmarks (e.g., OECD 3–7%, Stern Review 1.4%).
    • Red Flag: Rate outside empirical ranges or lacks transparency.
    • 3. Audit Cost and Benefit Valuation

    • Check for:
    • Missing opportunity costs (e.g., alternative project uses).
    • Over/underestimation of intangibles (e.g., health, culture).
    • Red Flag: Use of proxy values without sensitivity testing.
    • 4. Examine Data Sources and Assumptions

    • Verify:
    • Independence of data providers (e.g., industry-funded studies).
    • Realism of growth/price forecasts (e.g., historical vs. projected trends).
    • Red Flag: Reliance on single-source or outdated data.
    • 5. Assess Stakeholder Engagement

    • Evaluate:
    • Representation (e.g., indigenous communities, future generations).
    • Feedback mechanisms (e.g., public consultations, peer review).
    • Red Flag: Tokenistic participation or no dissenting views included.
    • 6. Apply Bias Mitigation Techniques

    • For detected biases:
    • Discount Rate: Use a range (e.g., 3–7%) and test extremes.
    • Valuation: Combine market and non-market methods (e.g., hedonic pricing + contingent valuation).
    • Stakeholders: Conduct deliberative polling or citizen assemblies for contested issues.
    • 7. Document and Disclose

    • Publish:
    • Full methodology, including excluded scenarios
    • what is cost benefit analysis - Ilustrasi 3

      Tools and Techniques for Implementation in Cost-Benefit Analysis

      Cost-Benefit Analysis (CBA) relies on systematic tools and techniques to quantify financial and non-financial impacts, ensuring decisions are data-driven and defensible. The selection of appropriate software and methodologies depends on project complexity, data availability, and stakeholder requirements. Below are structured insights into widely used tools, practical implementation via spreadsheets, visualization techniques, and comparisons between traditional and modern CBA approaches.

      Five Software/Tools for Cost-Benefit Analysis Calculations

      The choice of tool influences accuracy, scalability, and ease of use in CBA. Below are five commonly employed software solutions, each with distinct advantages and limitations tailored to different analytical needs.
      Key Considerations for Tool Selection:
    • Data Input Flexibility: Ability to handle qualitative/quantitative data.
    • Monetization Capabilities: Tools for converting non-monetary benefits (e.g., health, environment) into monetary terms.
    • Discounting and Sensitivity Analysis: Built-in functions for NPV, IRR, and scenario testing.
    • Collaboration Features: Cloud-based or shared access for multi-stakeholder projects.
    • Regulatory Compliance: Alignment with standards (e.g., Green Book for UK public sector, FAST-44 for U.S. federal projects).
      • Microsoft Excel (with Add-ins)
        • Description: A spreadsheet tool widely used for basic to intermediate CBA due to its accessibility and customization. Add-ins like @RISK (Palisade) or Crystal Ball enhance probabilistic analysis.
        • Pros:
          • User-friendly interface with familiar functions (e.g., NPV via `=NPV(rate, series)`).
          • Supports manual or automated data input from external sources (CSV, databases).
          • Cost-effective for small-scale projects or one-off analyses.
          • Integrates with visualization tools (e.g., Power BI, Tableau).
        • Cons:
          • Limited to linear models; complex dependencies require manual adjustments.
          • No built-in monetization frameworks for non-market values (e.g., ecosystem services).
          • Scalability issues for large datasets or multi-year projects.
        • Best For: Small businesses, startups, or preliminary analyses where simplicity and low cost are prioritized.
      • R (with Packages: benefit, decision, dplyr)
        • Description: An open-source programming language for statistical computing, offering advanced CBA functionalities through specialized packages. The benefit package, for example, automates cost-effectiveness analysis (CEA) and cost-utility analysis (CUA).
        • Pros:
          • Highly customizable for complex scenarios (e.g., stochastic modeling, Bayesian analysis).
          • Supports monetization of non-market values using stated preference techniques (e.g., contingent valuation).
          • Free and open-source, with a growing community for troubleshooting.
          • Handles large datasets efficiently with dplyr for data manipulation.
        • Cons:
          • Steep learning curve for non-programmers.
          • Requires manual setup for visualization compared to dedicated CBA software.
          • Limited user support for regulatory compliance checks.
        • Best For: Researchers, policymakers, or analysts needing bespoke models with probabilistic outputs.
      • Cost-Benefit Analysis Software: Cost-Benefit Pro (by Cost-Benefit Pro LLC)
        • Description: A specialized tool designed specifically for CBA, incorporating monetization templates (e.g., for healthcare, transportation, or environmental projects) and compliance with international standards (e.g., OECD, World Bank).
        • Pros:
          • Pre-built monetization frameworks for non-market values (e.g., willingness-to-pay surveys, hedonic pricing).
          • Automated sensitivity analysis and risk assessment modules.
          • Regulatory reporting features (e.g., generating outputs for government submissions).
          • Cloud-based collaboration for team projects.
        • Cons:
          • High licensing costs, prohibitive for small businesses or academic use.
          • Overkill for simple projects with straightforward cost/benefit structures.
          • Limited flexibility for non-standard CBA methodologies.
        • Best For: Large-scale public or private sector projects requiring compliance with standardized CBA protocols.
      • Python (with Libraries: PyMC, NumPy, Pandas, Matplotlib)
        • Description: A versatile language for CBA, particularly suited for machine learning-driven analyses or large-scale simulations. Libraries like PyMC enable probabilistic modeling, while Pandas simplifies data handling.
        • Pros:
          • Scalability for big data applications (e.g., analyzing millions of data points).
          • Integration with AI/ML tools for predictive modeling (e.g., forecasting future costs/benefits).
          • Open-source and free, with extensive documentation.
          • Strong visualization capabilities via Matplotlib or Seaborn.
        • Cons:
          • Requires programming expertise; not ideal for non-technical users.
          • Lack of built-in CBA-specific templates (unlike Excel or dedicated software).
          • Setup and maintenance overhead for complex projects.
        • Best For: Data-intensive projects (e.g., urban planning, climate policy) where custom algorithms are necessary.
      • @RISK and PrecisionTree (Palisade Corporation)
        • Description: Add-ons for Excel designed for Monte Carlo simulation and decision tree analysis. @RISK models uncertainty in CBA inputs, while PrecisionTree visualizes decision pathways.
        • Pros:
          • Robust probabilistic modeling for uncertain variables (e.g., project delays, inflation rates).
          • User-friendly interface with drag-and-drop functionality for decision trees.
          • Seamless integration with Excel for familiar workflows.
          • Outputs distributions for NPV, BCR, and other metrics.
        • Cons:
          • Subscription-based pricing adds long-term costs.
          • Limited to Excel’s ecosystem; not standalone software.
          • Less suitable for large-scale or highly complex models.
        • Best For: Projects with significant uncertainty (e.g., R&D investments, infrastructure) where risk assessment is critical.

      Building a Simple Cost-Benefit Analysis Model in a Spreadsheet

      Spreadsheet-based CBA models are foundational for small businesses or preliminary evaluations. Below is a step-by-step guide to constructing a model in Excel, using a hypothetical scenario: a café investing in a new espresso machine.
      Sample Dataset Assumptions:
    • Initial Cost (Year 0): $20,000 (machine purchase + installation).
    • Annual Operating Costs: $5,000 (maintenance, beans, labor).
    • -

      Case Studies and Real-World Examples in Cost-Benefit Analysis

      Cost-Benefit Analysis (CBA) demonstrates its value through real-world applications where its rigor and foresight shape decisions with lasting impact. High-profile projects, such as infrastructure megaprojects or policy interventions, often serve as benchmarks for evaluating CBA’s effectiveness. These case studies reveal how methodological rigor, stakeholder engagement, and adaptive frameworks influence outcomes—whether in mitigating risks, justifying investments, or exposing systemic flaws. Below, structured analyses of successful and controversial CBAs, hypothetical scenarios for critical thinking, and a narrative of a failed CBA illustrate the nuanced interplay between theory and practice.

      Deep Dive: The Thames Barrier Cost-Benefit Analysis

      The Thames Barrier, completed in 1982, stands as one of the most scrutinized infrastructure CBAs in history, designed to protect London from tidal surges and river flooding. The project’s feasibility hinged on a CBA conducted by the Greater London Council (GLC) and the Environment Agency, which quantified flood risks, economic damages, and mitigation costs over a 100-year horizon. Key elements of the analysis included:

      - Flood Risk Modeling: Hydrological data from the 1953 North Sea flood (which killed 307 in the UK) projected recurrence intervals for extreme tides, estimating a 1-in-1,000-year event as the design threshold. The GLC’s hydrological studies incorporated probabilistic assessments, a novel approach at the time.

    • Monetization of Benefits: Benefits were categorized into direct (property damage avoidance, business continuity) and indirect (reduced insurance premiums, preserved cultural heritage). The barrier’s estimated £1 saved for every £1 spent over 30 years relied on conservative discount rates (5–6%) and long-term economic growth projections.
    • Contingency and Uncertainty: The CBA explicitly acknowledged epistemic uncertainty (e.g., climate change impacts) by including sensitivity analyses. For instance, scenarios assumed sea-level rise of 1–2 meters by 2100, though these were later revised upward.
    • Political and Public Acceptance: The GLC’s CBA faced skepticism from critics who argued the barrier was a "white elephant." However, the 1987 Great Storm—which caused £1.1 billion in damages (£3.5 billion in 2023 terms)—validated the barrier’s necessity within 15 years of operation, reinforcing CBA’s predictive power.
    • Outcomes and Lessons Learned:

    • Success: The barrier has prevented £6 billion in damages since its inception (Environment Agency, 2020) and remains operational despite exceeding its original design life. Its CBA’s emphasis on adaptive resilience (e.g., retrofitting for higher water levels) became a template for future flood defenses.
    • Methodological Innovations: The Thames Barrier CBA introduced multi-criteria decision-making to balance engineering feasibility with social equity, addressing concerns about displaced communities in flood zones.
    • Criticisms: Retrospective analyses note that climate change scenarios were underestimated. The 2014 IPCC report highlighted that the barrier’s original flood thresholds are now outdated, necessitating upgrades (e.g., the £500 million Thames Estuary 2100 Plan).
    • "The Thames Barrier’s CBA was not just about numbers—it was about embedding a culture of risk awareness into urban planning. Its legacy lies in proving that CBA must evolve with scientific and societal changes." — Sir Michael Pitt, Chair of the UK Pitt Review (2008 Post-Flood Inquiry)

      Comparative Analysis: Successful vs. Controversial CBAs

      The following table contrasts two high-profile CBAs—one widely regarded as successful and another mired in controversy—to highlight divergent outcomes, methodological strengths, and ethical dilemmas.
      Project Name Key Findings Outcome Criticisms
      Thames Barrier (UK, 1982)
      • Net present value (NPV) of £1.4 billion (1982 prices) with a benefit-cost ratio of 2.2:1 over 30 years.
      • Flood risk reduction from 1-in-1,000-year to 1-in-10,000-year event for central London.
      • Indirect benefits: £2.5 billion in avoided economic disruption (adjusted for inflation).
      • Included distributional weights to prioritize low-income flood-prone areas.
      • Operational since 1982; prevented £6 billion in damages (2023 estimate).
      • Extended lifespan through adaptive upgrades (e.g., 2010–2014 maintenance).
      • Used as a global model for flood defense CBAs (e.g., Rotterdam Water Plaza, Netherlands).
      • Climate change underestimation: Original sea-level rise projections were 50% lower than current IPCC estimates.
      • Political opposition: Labelled as "vanity project" by Conservative critics during construction.
      • Data gaps: Limited long-term hydrological records for probabilistic modeling.
      Three Gorges Dam (China, 2008)
      • Initial CBA (1992) claimed NPV of $30 billion with benefits including hydroelectricity, flood control, and shipping improvements.
      • Flood risk reduction: 10 million people protected from downstream flooding (Yangtze River basin).
      • Energy generation: 22.5 GW capacity, reducing coal reliance by 31 million tons annually.
      • Shipping benefits: 10 million tons/year in reduced transport costs.
      • Completed in 2012; largest hydroelectric dam by installed capacity.
      • Generated $100 billion in revenue (2008–2020) from electricity sales and tourism.
      • Reduced Yangtze flooding severity (e.g., 2020 floods had lower casualties than pre-dam events).
      • Ecological costs: 1.3 million displaced, leading to landslides and soil erosion in resettlement zones.
      • Siltation: 60% reduction in sediment flow, accelerating coastal erosion downstream.
      • Methodological flaws: Benefits were overstated (e.g., flood control efficacy weakened by upstream deforestation).
      • Ethical violations: No meaningful consultation with displaced communities; forced relocations violated human rights norms.
      • Seismic risks: Increased earthquake vulnerability in the dam’s foundation (geological studies were suppressed).
      Contextual Insights:
      The Thames Barrier’s CBA succeeded by integrating adaptive management and transparent uncertainty quantification, while the Three Gorges Dam’s analysis failed to account for non-market values (e.g., biodiversity, cultural heritage) and long-term systemic risks. The contrasting outcomes underscore the importance of:
    • Stakeholder inclusivity (e.g., Thames Barrier’s public hearings vs. Three Gorges’ top-down approach).
    • Dynamic modeling (e.g., Thames’ probabilistic flood scenarios vs. Three Gorges’ static risk assessments).
    • Ethical safeguards (e.g., distributional analysis in Thames vs. ignored displacement costs in Three Gorges).
    • Hypothetical Scenarios for Critical Thinking in CBA

      Hypothetical scenarios allow evaluators to stress-test CBA frameworks against unforeseen variables, fostering critical thinking about assumption sensitivity, ethical trade-offs, and systemic risks. Below are three scenarios designed to challenge conventional CBA approaches:

      1. The 2008 Financial Crisis: A C

      Cost-benefit analysis emerges not merely as a technical exercise but as a moral compass in decision-making, demanding transparency, inclusivity, and adaptability. As industries confront evolving challenges—such as the integration of artificial intelligence or the urgent need for climate-adaptive infrastructure—CBA continues to refine its methodologies to address new complexities. The key to its enduring relevance lies in its ability to evolve alongside societal priorities, whether through refined valuation techniques for intangible benefits or the incorporation of stakeholder feedback to prevent bias. Ultimately, CBA’s greatest strength is its capacity to turn abstract questions—"Is this investment worth the cost?"—into concrete, defensible answers, ensuring that progress is measured not just in dollars but in tangible improvements for communities and economies alike.

      FAQ

      How is cost-benefit analysis defined and applied in the field of economics?

      In economics, cost-benefit analysis (CBA) is a systematic method to compare the monetary costs of a project or policy with its expected benefits, often measured in terms of net present value or social welfare. It helps determine whether an investment or decision is economically justified by quantifying both tangible (e.g., revenue) and intangible (e.g., environmental) impacts. Governments and businesses use CBA to prioritize resource allocation, such as infrastructure projects or regulations, by assessing whether benefits outweigh costs over time.

      What role does cost-benefit analysis play in project management, and how is it used?

      In project management, cost-benefit analysis evaluates whether a project’s expected returns justify its expenses before, during, or after implementation. It identifies potential risks, compares alternatives, and helps stakeholders decide on feasibility by weighing upfront costs (e.g., labor, materials) against long-term gains (e.g., efficiency, revenue). Tools like payback periods or ROI are often integrated into this process to guide resource allocation.

      How is cost-benefit analysis relevant to psychology, and what does it measure there?

      In psychology, cost-benefit analysis examines the cognitive and behavioral trade-offs individuals or groups make when weighing risks versus rewards. It’s used to study decision-making under uncertainty, such as in behavioral economics or therapy (e.g., weighing the cost of anxiety relief against the effort of treatment). Researchers also apply it to evaluate interventions like workplace training or public health programs by measuring psychological benefits (e.g., reduced stress) against costs (e.g., time, money).

      What is the difference between cost-benefit analysis and cost-effectiveness analysis?

      Cost-benefit analysis (CBA) compares monetary costs to monetary benefits (e.g., dollars saved or gained), often including non-monetary factors converted to a common unit like "value." Cost-effectiveness analysis (CEA), however, compares costs to a single, non-monetary outcome (e.g., "cost per life saved") without converting all benefits to dollars. CBA is broader; CEA is more focused on optimizing a specific result within a fixed budget.

      How is cost-benefit analysis applied in healthcare, and what does it assess?

      In healthcare, cost-benefit analysis evaluates whether medical treatments, programs, or policies (e.g., vaccination campaigns, new drugs) provide benefits worth their costs, including direct expenses (e.g., hospital fees) and indirect costs (e.g., lost productivity). It quantifies outcomes like improved quality of life or reduced mortality in monetary terms (e.g., willingness-to-pay thresholds) to guide funding decisions. Critics argue ethical concerns arise when assigning monetary values to health outcomes.

      What is the purpose of cost-benefit analysis in library science, and how is it used?

      In library science, cost-benefit analysis helps libraries justify expenditures like purchasing e-books, hiring staff, or renovating spaces by comparing costs (e.g., subscription fees) to measurable benefits (e.g., increased patron usage, research output). It assesses whether investments improve service quality, accessibility, or community impact—often using metrics like circulation rates or user surveys. Libraries also use it to prioritize limited budgets amid competing demands (e.g., digital vs. physical resources).

      Leave a Comment

      Comments are moderated before appearing. The data you submit is processed according to the Privacy Policy of Voltefac.