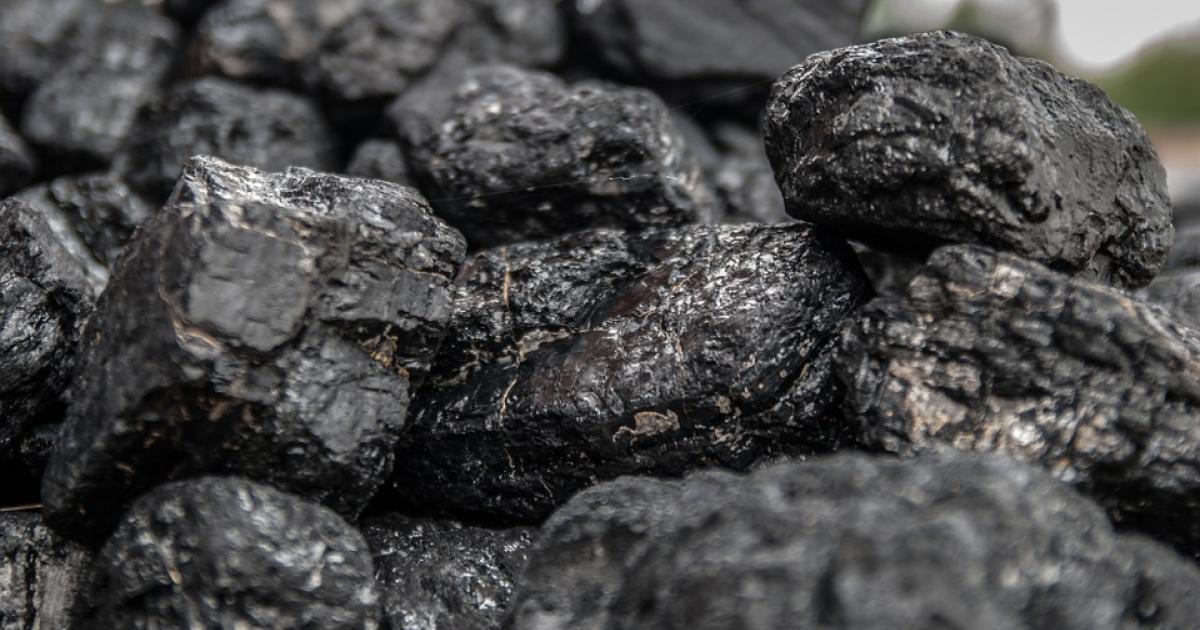
What Coal Is Its Formation Composition And Global Impact

Published

Table of Contents

Coal remains one of the world’s most critical fossil fuels, underpinning industrialization and energy infrastructure for centuries. Formed over millions of years from ancient plant matter subjected to intense geological pressure, its chemical complexity—ranging from high-carbon anthracite to moisture-rich lignite—determines its energy potential and environmental trade-offs. Beyond its role as a primary energy source, coal’s extraction and combustion shape global economies, public health, and ecological systems, making its study essential for understanding modern energy challenges.

The journey of coal begins with its scientific foundation, where its molecular structure and maceral composition dictate efficiency in combustion and industrial applications. From powering steel furnaces to generating electricity, each coal rank serves distinct purposes, yet its use carries profound consequences for air quality, climate change, and community livelihoods. This exploration examines coal’s geological origins, industrial applications, extraction methods, and the evolving technologies aimed at mitigating its environmental footprint—offering a comprehensive perspective on a resource that continues to define global energy dynamics.
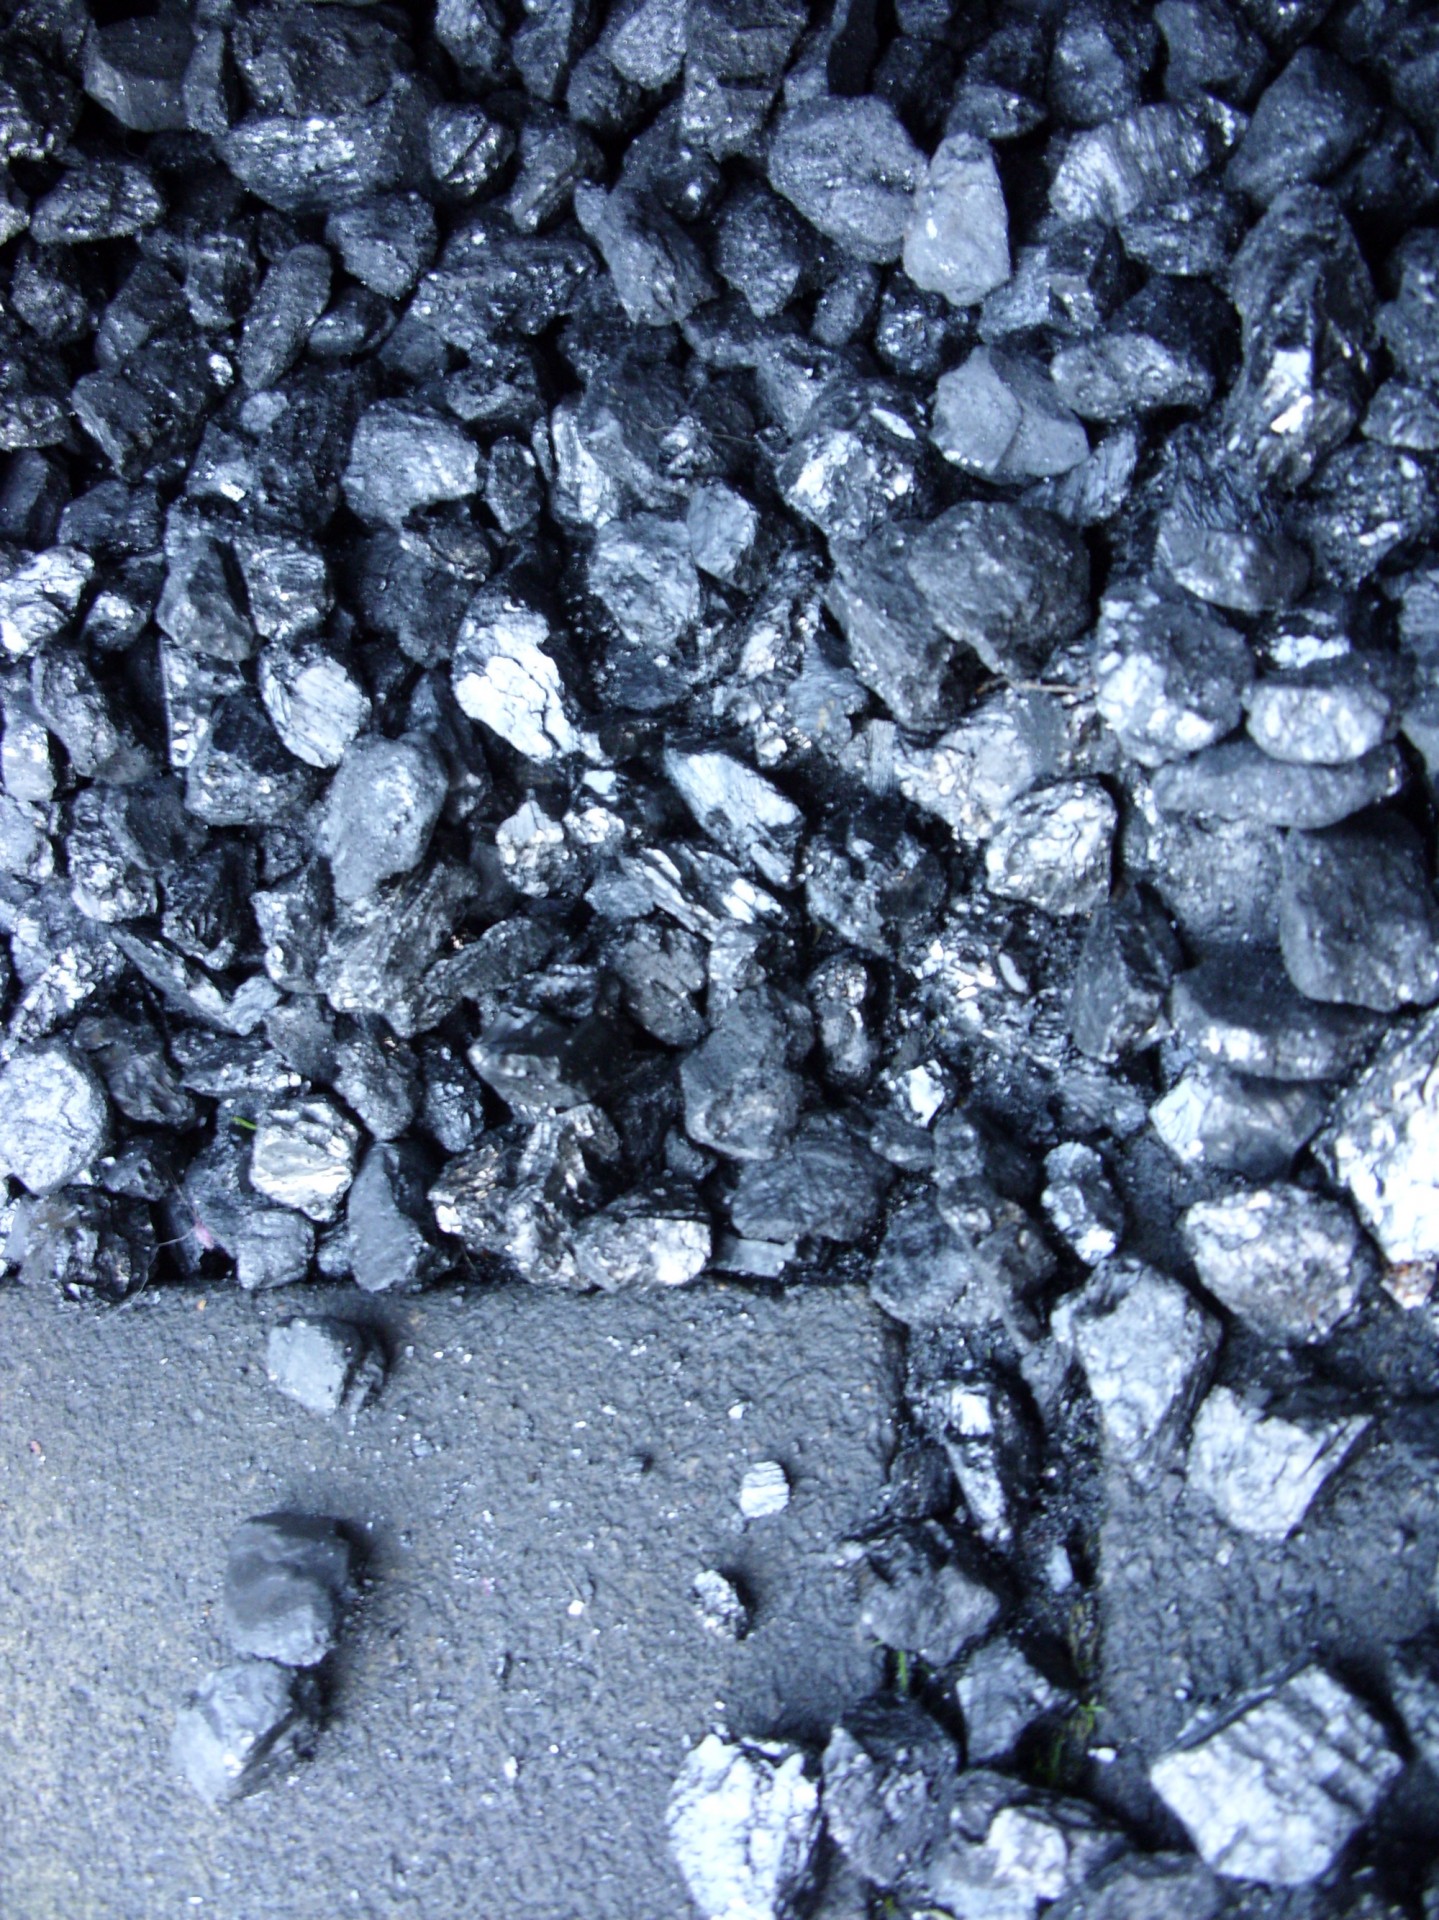
what coal is

Scientific Definition and Composition of Coal

Coal is a complex, sedimentary fossil fuel formed from the partial decomposition of organic matter—primarily plant material—under high pressure and temperature over geological timescales. Its composition varies significantly depending on rank, reflecting differences in carbon content, energy density, and molecular structure. Understanding coal’s chemical and physical properties is essential for assessing its industrial applications, environmental impact, and combustion efficiency. Below, the focus is on its elemental composition, molecular structure, geological formation, and the role of macerals in defining its characteristics.

Chemical Composition and Elemental Breakdown

Coal’s chemical composition is dominated by carbon (C), hydrogen (H), oxygen (O), nitrogen (N), and sulfur (S), with trace amounts of other minerals and inorganic elements. The proportions of these elements vary by coal rank, influencing properties such as calorific value, volatility, and reactivity.
Typical elemental composition by mass (approximate ranges):
  • Carbon (C): 60–95% (increases with rank; highest in anthracite).
  • Hydrogen (H): 2–6% (decreases with rank; highest in peat/lignite).
  • Oxygen (O): 5–30% (dominates in lower-rank coals; declines with maturation).
  • Nitrogen (N): 0.5–2.5% (relatively stable across ranks).
  • Sulfur (S): 0.5–8% (varies geographically; higher in bituminous coals from marine deposits).
  • Trace minerals: Aluminum (Al), silicon (Si), iron (Fe), calcium (Ca), and others (ash content typically 5–20%).
  • The carbon-to-hydrogen (C/H) ratio increases with coal rank, reflecting progressive aromatization and loss of volatile matter. Higher carbon content correlates with higher energy density and lower moisture content. Oxygen and hydrogen are primarily bound in functional groups (e.g., hydroxyl, carboxyl, methoxy), which influence coal’s reactivity during combustion or gasification.

    Molecular Structure and Rank-Specific Variations

    Coal’s molecular structure is a disordered, cross-linked polymer network composed of aromatic clusters, aliphatic chains, and functional groups. The degree of aromaticity and structural organization differs across ranks, dictating physical and chemical behavior.
    Key structural features by rank:
  • Peat/Lignite: Highly oxygenated, with amorphous, gel-like structures and minimal aromatic condensation. Contains intact plant cell walls and lignin-derived polymers.
  • Sub-bituminous: Increased aromaticity; partial loss of oxygen via decarboxylation. Maceral composition becomes more distinct.
  • Bituminous: Dominated by fused aromatic rings (polycyclic structures) with embedded aliphatic side chains. Highest plasticity during heating (coking potential).
  • Anthracite: Near-graphitic structure with extensive aromatic stacking. Minimal volatile matter; rigid, brittle texture.
  • Spectroscopic analysis (e.g., NMR, FTIR) reveals that bituminous coal exhibits the most complex molecular architecture, with:
  • Aromatic clusters (5–10 fused rings) interconnected by short aliphatic bridges.
  • Heteroatoms (O, N, S) incorporated into aromatic rings or as peripheral groups (e.g., phenolic OH, pyridinic N).
  • Cross-linking via ether, methylene, or disulfide bonds, contributing to thermal stability.
  • The aromaticity index (ratio of aromatic to aliphatic carbon) increases with rank, correlating with higher carbonization temperatures and lower hydrogen content.

    Geological Formation: From Plant Matter to Fossil Fuel

    Coal formation (coalification) is a multi-stage process spanning millions of years, driven by biochemical, physical, and thermal transformations of organic matter in anoxic environments. The sequence progresses through peat accumulation, burial, and metamorphism under increasing pressure and temperature.
    1. Accumulation of Plant Material
      Organic matter—primarily from swamp-dwelling plants (e.g., lycopods, ferns, mosses)—accumulates in waterlogged, anaerobic conditions, inhibiting aerobic decomposition. Lignin, cellulose, and resins resist full decay, forming peat, a precursor with high moisture (70–90%) and low carbon content (~50–60%).
    2. Diagenesis and Early Coalification
      Burial under sediment (1–3 km depth) initiates diagenesis, where microbial activity ceases, and physical compaction reduces porosity. Temperature rises to 50–100°C, triggering:
    3. Loss of water and volatile organic compounds (e.g., methane, CO₂).
    4. Partial aromatization of lignin-derived polymers.
    5. Result: Lignite, with carbon content of 60–70% and soft, crumbly texture.
    6. Catagenesis and Bituminization
      Further burial (3–6 km) exposes coal to 100–200°C, accelerating catagenesis:
    7. Decarboxylation removes CO₂, increasing carbon content.
    8. Aromatic rings condense, forming stable polycyclic structures.
    9. Moisture drops below 30%; coal hardens into sub-bituminous (70–77% C) or bituminous (77–92% C) ranks.
    10. Metagenesis and Anthracitization
      At depths exceeding 6 km and temperatures >200°C, metagenesis produces anthracite (92–98% C):
    11. Near-complete loss of volatile matter and hydrogen.
    12. Graphite-like crystalline order develops, with stacked aromatic layers.
    13. Coal becomes dense, black, and non-plastic.
    Key drivers of coalification:
  • Pressure: Compaction reduces pore space, increasing density.
  • Temperature: Controls reaction kinetics; higher temperatures favor aromatization.
  • Time: Slow processes (1–300 million years) ensure gradual transformation.
  • Comparison of Coal Ranks: Physical Properties and Energy Content

    The following table summarizes the distinguishing physical and chemical properties of coal ranks, including color, hardness, energy content, and maceral composition. Data is derived from standard geological and fuel analysis protocols (e.g., ASTM D388, ISO 11760).
    Property Peat Lignite Sub-bituminous Bituminous Anthracite
    Carbon Content (%) 50–60 60–70 70–77 77–92 92–98
    Hydrogen Content (%) 5–6 4–6 4–5 3–5 1–3
    Oxygen Content (%) 25–35 15–25 10–20 5–15 1–5
    Moisture Content (%) 70–90 30–45 10–30 1–10 1–5
    Volatile Matter (%) 50–70 40–50 30–40 15–40 2–8
    Calorific Value (MJ/kg) 8–15 15–24 24–30 24–35 26–

    Types of Coal and Their Industrial Applications

    Coal ranks represent distinct stages of coalification, each characterized by varying energy content, chemical composition, and industrial utility. The five primary coal ranks—lignite, sub-bituminous, bituminous, semi-anthracite, and anthracite—are classified based on moisture content, volatile matter, fixed carbon, and calorific value. These properties directly influence their suitability for power generation, metallurgy, and manufacturing, as well as their environmental footprint. Below, the classification, industrial applications, and comparative emissions profiles of each rank are examined, followed by an analysis of coal processing techniques essential for optimizing performance and reducing impurities.

    Classification of Coal Ranks by Composition and Properties

    The progression from lignite to anthracite reflects increasing carbon content and energy density, accompanied by a reduction in moisture and volatile matter. The following table summarizes the key physicochemical properties of each coal rank, including moisture content, volatile matter, fixed carbon, and gross calorific value (GCV), measured in megajoules per kilogram (MJ/kg) on an as-received basis.
    Coal Rank Moisture Content (%) Volatile Matter (%) Fixed Carbon (%) Gross Calorific Value (MJ/kg)
    Lignite 40–60 40–50 20–30 8–16
    Sub-bituminous 20–40 30–40 30–45 16–24
    Bituminous 8–20 15–35 45–60 24–35
    Semi-anthracite 5–15 8–15 60–75 28–32
    Anthracite 2–8 2–8 75–90 32–35
    Note: Values are approximate and may vary based on geological formation and regional deposits. Moisture and volatile matter percentages are typically determined via ASTM D3175 (proximate analysis), while calorific value is measured using ASTM D5865 (bomb calorimetry).

    Industrial Applications by Coal Rank

    The selection of coal for industrial processes depends on energy requirements, combustion efficiency, and byproduct needs. Higher-rank coals (e.g., anthracite, bituminous) are preferred in applications demanding high heat output and low emissions, whereas lower-rank coals (e.g., lignite, sub-bituminous) are often used in regions with abundant local deposits despite their lower efficiency.

    Power Generation
    Coal remains the dominant fuel for electricity production, accounting for ~30% of global primary energy consumption (IEA, 2022). The choice of coal rank influences boiler design, combustion temperature, and emission control strategies:

  • Lignite and Sub-bituminous: Predominantly used in pulverized coal (PC) boilers with fluidized bed combustion (FBC) due to their high moisture content, which requires pre-drying or atmospheric fluidized bed systems. Examples include lignite-fired plants in Germany (e.g., Niederaußem Power Station) and sub-bituminous coal in the Powder River Basin (USA).
  • Bituminous: The most versatile rank for PC boilers, capable of achieving higher combustion temperatures (1,500–1,700°C) and efficiencies (~35–45%). Bituminous coal is standard in supercritical and ultra-supercritical plants, such as China’s Tuoketuo Power Station.
  • Anthracite: Rarely used in power generation due to its high fixed carbon content, which leads to incomplete combustion and slagging. However, it is blended with bituminous coal in some European plants to reduce NOₓ emissions.
  • Steel Production
    Coking coal, a subset of bituminous coal with specific coking properties (e.g., high vitrinite content, low ash), is essential for blast furnace operations. The metallurgical coke produced from coking coal must meet strict specifications for porosity, strength, and reactivity:

  • Bituminous (Coking Coal): Used exclusively in blast furnaces to reduce iron ore via carbon monoxide gas. Examples include Australian coking coal (e.g., Appin seam) and Russian Kuzbass coal, which supply global steel mills.
  • Non-coking Bituminous: Employed in direct reduction processes (e.g., Midrex or HYL-3) or as a supplementary fuel in steelmaking, particularly in electric arc furnaces (EAFs). Indian steel plants often use non-coking bituminous coal for EAFs due to its lower cost.
  • Lignite/Sub-bituminous: Not suitable for coke production but used as a fuel in sintering plants or as a substitute for coke in some emerging markets (e.g., Turkey’s Karabük Steel).
  • Cement Manufacturing
    The cement industry relies on coal for kiln firing, where heat (1,450–1,500°C) is required to produce clinker. Coal rank influences fuel consumption, clinker quality, and emissions:

  • Lignite: Common in cement plants in Europe (e.g., Spain’s Holcim facilities) and India due to its high reactivity, though its low energy density increases fuel costs.
  • Sub-bituminous/Bituminous: Standard in modern cement kilns, offering a balance between cost and efficiency. For example, LafargeHolcim’s plants in the U.S. use Powder River Basin sub-bituminous coal.
  • Anthracite: Occasionally used in rotary kilns for its clean combustion, but its high cost limits widespread adoption.
  • Environmental Impact of Coal Combustion by Rank

    The emissions profile of coal combustion varies significantly with rank, primarily due to differences in sulfur content, volatile matter, and nitrogen compounds. Lower-rank coals generally exhibit higher moisture and sulfur content, leading to greater particulate matter (PM) and sulfur dioxide (SO₂) emissions, while higher-rank coals produce more carbon dioxide (CO₂) per unit energy due to their higher carbon content.
    Emissions Parameter Lignite Sub-bituminous Bituminous Anthracite
    CO₂ (kg/GJ) 95–105 90–100 85–95 80–90
    SO₂ (kg/GJ) 1.5–4.0 0.5–2.0 0.3–1.5 0.1–0.5
    NOₓ (kg/GJ) 0.4–0.8 0.3–0.6 0.2–0.5 0.1–0.3
    Particulate Matter (kg/GJ) 0.8–2.0 0.5–1.2 0.2–0.8 0.1–0.4
    Key Observations:
  • CO₂ Emissions: Anthracite and bituminous coals emit less CO₂ per gigajoule (GJ) than lignite due to their higher energy density, but absolute emissions
  • what coal is - Ilustrasi 2

    Coal Extraction Methods and Global Mining Practices

    Coal extraction remains a cornerstone of global energy production, with methods varying significantly based on geological conditions, economic feasibility, and environmental regulations. Surface and underground mining dominate extraction practices, each employing specialized techniques tailored to geological formations and resource accessibility. The geographical distribution of coal reserves and production highlights key challenges, including safety hazards, environmental degradation, and logistical complexities in transporting coal from mines to end-users. Economic factors further influence extraction strategies, with labor costs, automation, and government policies shaping industry dynamics.

    The selection of extraction methods depends on coal seam depth, topography, and local infrastructure. Surface mining, including open-pit and mountaintop removal, is preferred for shallow seams, while underground mining, such as longwall and room-and-pillar, targets deeper deposits. Geographical disparities in coal production reveal distinct regional challenges, from water contamination in India to land subsidence in the USA. Transportation networks—comprising rail, barge, and truck systems—ensure coal reaches power plants efficiently, though their efficiency varies by region.

    Primary Coal Extraction Methods

    Coal extraction methods are categorized into two broad approaches: surface mining and underground mining, each with sub-techniques optimized for specific geological and operational conditions.

    Surface mining is employed when coal seams are located near the Earth’s surface, typically within 60 meters (200 feet) depth. This method is cost-effective and allows for high extraction rates but poses significant environmental risks, including habitat destruction and soil erosion. Open-pit mining involves removing overburden (rock and soil) to expose coal seams, often used in flat or gently sloping terrains. Mountaintop removal, a controversial variant, involves blasting off entire mountaintops to access coal seams beneath, primarily practiced in the Appalachian region of the USA. This technique generates massive waste rock and alters landscapes permanently.

    Underground mining is necessary for deeper coal seams, often exceeding 60 meters. Longwall mining is the most mechanized method, using a shearer machine to extract coal in long, rectangular blocks while hydraulic supports hold the roof. Room-and-pillar mining leaves pillars of coal to support the mine roof, extracting coal in a grid-like pattern. Both methods require extensive ventilation and safety measures due to risks of roof collapses, gas explosions, and respiratory diseases among workers.

    Surface mining accounts for approximately 60% of global coal production, while underground mining contributes the remaining 40%, though proportions vary by region (World Coal Association, 2023).

    Geographical Overview of Major Coal-Producing Regions

    Global coal production is concentrated in five countries—China, India, the USA, Australia, and Indonesia—each facing unique geological, environmental, and socio-economic challenges.

    China dominates global coal production, accounting for over 50% of the world’s output, primarily through underground mining in the northern provinces of Shanxi and Inner Mongolia. Safety remains a critical issue, with frequent mine collapses and gas explosions due to deep-seated seams and outdated infrastructure. Water contamination from acid mine drainage and land subsidence from underground mining further exacerbate environmental concerns.

    India, the second-largest producer, relies heavily on open-cast mining in Jharkhand and Chhattisgarh, where monsoon rains trigger landslides and soil erosion. Illegal mining and labor disputes also hinder sustainable operations. The USA, particularly the Powder River Basin and Appalachia, employs a mix of surface and underground methods, with mountaintop removal sparking legal battles over environmental degradation.

    Australia, the third-largest exporter, utilizes large-scale open-cut mines in Queensland and New South Wales, where water scarcity and dust pollution pose operational challenges. Indonesia, a key exporter to Asia, leverages open-pit mining in Sumatra and Kalimantan, often facing deforestation and community displacement due to rapid industrialization.

    The Powder River Basin (USA) and Qinhuangdao Port (China) are critical coal logistics hubs, handling over 40% of global seaborne coal trade (IEA, 2022).

    Coal Transportation Logistics from Mines to Power Plants

    Efficient coal transportation is essential to maintain energy supply chains, with rail, barge, and truck systems serving as primary modes. The choice of transport method depends on geographical proximity, infrastructure availability, and cost efficiency.

    Rail transport dominates in regions with extensive railway networks, such as the USA and China. Unit trains, comprising 100+ wagons, transport coal from mines to power plants at minimal cost per ton. For example, the BNSF Railway (USA) operates dedicated coal routes from Wyoming to Midwest power stations, reducing transit times to under 48 hours. Barge transport is preferred in riverine regions like the Mississippi River (USA) and Ganges Delta (India), offering lower costs but limited by seasonal water levels and port capacities.

    Truck transportation is used for short distances, particularly in fragmented landscapes or where rail/barge infrastructure is absent. However, it incurs higher operational costs and contributes to road wear and emissions. Conveyor belts are employed in integrated mining-power plant complexes, such as those in Germany and Poland, to minimize handling losses and environmental impact.

    The average cost of coal transport varies by method:
  • Rail: $5–$15 per ton (long-distance)
  • Barge: $3–$8 per ton (riverine)
  • Truck: $20–$50 per ton (short-haul)
  • Top 5 Coal-Producing Countries and Extraction Methods

    The following table summarizes the leading coal producers, their annual output, and dominant extraction techniques, reflecting regional specializations and challenges.
    Country Annual Production (2023, million metric tons) Dominant Extraction Methods Key Mining Regions Primary Challenges
    China 4,000 Underground (longwall, room-and-pillar); Surface (open-pit) Shanxi, Inner Mongolia, Shaanxi Mine safety, water pollution, labor shortages
    India 850 Surface (open-cast); Underground (limited) Jharkhand, Chhattisgarh, Odisha Illegal mining, monsoon-induced landslides
    United States 500 Surface (open-pit, mountaintop removal); Underground (longwall) Wyoming (Powder River Basin), West Virginia (Appalachia) Environmental regulations, labor disputes
    Australia 500 Surface (open-cut, strip mining) Queensland (Bowen Basin), New South Wales Water scarcity, dust pollution, indigenous land rights
    Indonesia 600 Surface (open-pit) South Sumatra, East Kalimantan Deforestation, community displacement

    Economic Factors Influencing Coal Mining

    Coal mining economics are shaped by labor costs, technological automation, and government policies, which collectively determine industry competitiveness and sustainability.

    Labor costs vary significantly by region, with China and India relying on lower-wage workforces, while Australia and the USA incur higher salaries due to stricter labor laws and unionization. Automation has reduced reliance on manual labor in developed markets, with longwall mining systems and drilling rigs minimizing workforce requirements. However, high initial capital costs and maintenance expenses limit automation adoption in emerging economies.

    Government subsidies and regulations play a pivotal role in shaping coal viability. Subsidies in China and India sustain domestic production despite environmental costs, while Europe and the USA impose stricter emissions controls, increasing operational expenses. Carbon pricing mechanisms, such as those in the EU Emissions Trading System (ETS), further elevate costs for coal-dependent industries. Conversely, tax incentives for renewable energy in countries like Germany and Japan accelerate the phase-out of coal plants, disrupting traditional supply chains.

    The global average cost of coal production ranges from $20–$80 per

    Energy Production and Coal’s Role in Global Power Grids

    Coal remains a cornerstone of global electricity generation, accounting for over 35% of global electricity production as of recent data, despite declining shares in developed economies. Its dominance stems from high energy density, reliability, and established infrastructure, though its environmental impact drives ongoing technological and policy shifts. This section examines the technical processes of coal-to-electricity conversion, its comparative efficiency against renewables, and emerging mitigation strategies to align with decarbonization goals.

    Coal Combustion and Power Plant Operations

    The conversion of coal into electricity in thermal power plants follows a multi-stage process optimized for efficiency and scale. Pulverized coal combustion dominates modern plants, where coal is ground into fine particles and burned in boilers to heat water into high-pressure steam. This steam drives turbine generators, which convert mechanical energy into electrical power via electromagnetic induction. The generated electricity is then transmitted through high-voltage grids to consumers, with efficiency losses (~6–10%) occurring during transmission.

    Key components of the process include:

  • Boiler Systems: Modern subcritical and supercritical boilers operate at temperatures exceeding 540–600°C and pressures up to 300 bar, improving thermal efficiency to 35–45% (compared to ~30% in older subcritical plants).
  • Steam Turbines: Multi-stage turbines extract energy sequentially—high-pressure, intermediate-pressure, and low-pressure stages—maximizing work output before steam condenses back into water for reuse.
  • Cooling Systems: Once-through or closed-loop cooling towers dissipate waste heat, with the latter reducing water consumption but increasing energy demand for recirculation.
  • Thermal Efficiency Formula:
    Efficiency (%) = (Net Electrical Output / Heat Input from Coal) × 100
    Example: A 600 MW plant burning 200,000 tons of coal annually (heat content: ~24 MJ/kg) achieves ~38% efficiency, producing ~1,800 TJ of electricity.

    Coal’s Share in Global Primary Energy Consumption

    Coal’s contribution to global primary energy consumption reflects divergent trends between developed and emerging economies, shaped by industrialization phases, resource endowments, and energy transition policies. As of 2023, coal accounts for:
  • ~27% of global primary energy supply (down from ~30% in 2010), with ~60% used for electricity generation.
  • Developed Economies (OECD): Coal’s share has halved since 2000, now below 10% (e.g., EU: ~15%, U.S.: ~20%), replaced by gas, renewables, and nuclear.
  • Emerging Economies (Non-OECD): Coal remains critical, supplying ~70% of electricity in India and ~60% in China, driven by rapid urbanization and industrial growth. China alone consumes ~50% of global coal, with annual demand exceeding 3 billion tons.
  • Regional Disparities in Coal Consumption (2023):
  • Asia-Pacific: 80% of global coal use (China + India = 65%).
  • Europe: <10% (Germany: ~25% in 2022 due to gas crisis).
  • Africa: ~40% of electricity from coal (South Africa: 80%).
  • Projected Trends:
  • The International Energy Agency (IEA) forecasts coal’s share in electricity to decline to ~20% by 2040 under stringent climate policies, but ~25% without additional mitigation.
  • India and Southeast Asia may see coal demand peak by 2030–2040, while China’s coal use could plateau by 2025 due to renewable deployments.
  • Comparison with Renewable Energy Sources

    Coal-fired power plants differ fundamentally from renewable energy sources (solar, wind, hydro) in capacity factor, scalability, and energy storage requirements, influencing their role in grid stability and decarbonization strategies.
    MetricCoal-Fired PlantsRenewable Energy (Solar/Wind)
    Capacity Factor50–70% (continuous operation)20–40% (variable, weather-dependent)
    ScalabilityLarge-scale (1,000+ MW units), centralizedModular (MW to GW), distributed
    Energy Storage NeedsMinimal (base-load generation)High (batteries, pumped hydro, or gas backup)
    Response TimeSlow (hours to ramp up/down)Fast (seconds to minutes for adjustments)
    Fuel CostsLow ($20–$50/MWh for fuel)Near-zero ($0–$10/MWh for wind/solar)
    Capital CostsHigh ($1,500–$3,000/kW)Low ($1,000–$2,000/kW for solar/wind)
    Key Insights:
  • Capacity Factor: Coal’s high capacity factor makes it ideal for baseload power, while renewables require hybrid systems (e.g., solar + storage) to match demand.
  • Grid Integration: Renewables’ intermittency necessitates flexible generation (e.g., gas peaker plants) or grid-scale storage (e.g., lithium-ion batteries, compressed air).
  • Levelized Cost of Energy (LCOE):
  • Coal: $50–$100/MWh (including emissions costs).
  • Solar PV: $30–$60/MWh (utility-scale).
  • Onshore Wind: $25–$50/MWh.
  • (Source: IRENA, 2023)

    Hybrid Systems:

  • Coal + Renewables: Plants like India’s NTPC’s solar-coal hybrids (e.g., 500 MW solar + 1,320 MW coal) improve flexibility.
  • Renewables + Storage: Tesla’s Hornsdale Power Reserve (Australia) demonstrates wind + battery systems achieving ~90% capacity factor with storage.
  • Lifecycle of Coal: From Extraction to Electricity Generation

    The lifecycle of coal encompasses mining, transportation, combustion, and waste management, each stage contributing to environmental and economic impacts. Below is a simplified flowchart with key stages and byproducts:

    [Coal Seam Identification] → [Mining (Surface/Underground)] → [Transportation (Rail/Road)] → [Power Plant]
    │ │
    │ ▼
    [Crushing & Pulverization] → [Boiler Combustion] → [Steam Turbine] → [Electricity Transmission] → [Grid Distribution]
    │ │
    │ ▼
    [Waste Byproducts: Fly Ash, Slag, Bottom Ash, Flue Gas (SO₂, NOₓ, CO₂)] → [Disposal/Utilization]

    Detailed Breakdown:
    1. Mining:

  • Surface Mining (80% of global coal): Stripping vegetation and topsoil exposes seams; ~3–5 tons of overburden per ton of coal.
  • Underground Mining (20%): Longwall or room-and-pillar methods, with higher labor risks and methane emissions.
  • 2. Transportation:
  • Rail dominates (e.g., China’s coal trains: 10,000+ km routes).
  • Road transport used for short distances (e.g., U.S. coal trucks: ~1 ton CO₂ per ton-km).
  • 3. Combustion Byproducts:
  • Fly Ash: Fine particulate matter (20–30% of coal mass) used in cement, bricks, or landfilled.
  • Slag: Molten ash solidified into glass-like material for road construction.
  • Flue Gas: Contains SO₂ (sulfur dioxide), NOₓ (nitrogen oxides), and CO₂ (carbon dioxide), requiring scrubbers, ESPs (electrostatic precipitators), and CCS (carbon capture).
  • Environmental Impact per Ton of Coal Burned:
  • CO₂ Emissions: ~2.3 tons (high-sulfur coal) to ~1.8 tons (anthracite).
  • SO₂ Emissions: ~0.02–0.05 tons (without scrubbers).
  • Water Usage: ~20–50 liters/MWh (cooling towers).
  • Emerging Technologies to Reduce Coal’s Environmental Foot

    what coal is - Ilustrasi 3

    Environmental and Health Impacts of Coal Usage

    Coal remains a dominant energy source globally, yet its extraction, processing, and combustion impose severe environmental and public health burdens. The combustion of coal releases a complex mixture of pollutants, including heavy metals, particulate matter, and greenhouse gases, which directly contribute to respiratory diseases, cardiovascular mortality, and long-term ecological degradation. Beyond air pollution, coal mining disrupts landscapes, contaminates water sources, and displaces communities, underscoring its multifaceted societal and environmental costs. This section examines the primary pollutants emitted during coal combustion, their physiological impacts, and the regional disparities in exposure, alongside the ecological and socioeconomic consequences of coal dependency.

    Primary Pollutants from Coal Combustion and Their Health Effects

    The combustion of coal releases a diverse array of toxic substances, with mercury (Hg), arsenic (As), lead (Pb), and fine particulate matter (PM₂.₅) posing the most immediate and severe health risks. These pollutants originate from both the organic and inorganic constituents of coal, with their concentrations varying based on coal rank, combustion efficiency, and emission control technologies.

    Mercury, a neurotoxin, is released primarily as elemental mercury vapor during combustion and can bioaccumulate in aquatic ecosystems, entering the food chain. Chronic exposure leads to neurological damage, particularly in children, and has been linked to cognitive impairments and motor skill deficits. Arsenic, another carcinogen, accumulates in the liver, kidneys, and lungs, increasing the risk of lung cancer, bladder cancer, and cardiovascular diseases. Lead exposure, while declining due to regulatory measures, persists in coal-dependent regions, affecting child development and hematological systems.

    The most pervasive and lethal pollutant is PM₂.₅—particulate matter with aerodynamic diameters ≤2.5 micrometers. These particles penetrate deep into the respiratory system, triggering asthma, chronic obstructive pulmonary disease (COPD), and acute respiratory infections. Long-term exposure elevates the risk of cardiovascular mortality by promoting atherosclerosis and hypertension. A 2018 study by the Lancet Planetary Health estimated that 8.7 million premature deaths annually are attributable to ambient air pollution, with coal combustion contributing disproportionately to this toll, particularly in South Asia (India and Bangladesh) and Eastern Europe (Poland and Romania).

    The global distribution of coal-related deaths reflects historical industrialization patterns, energy access disparities, and regulatory enforcement gaps. South Asia remains the most severely affected region, where household coal use for cooking and heating, combined with lack of emission controls in industrial plants, exacerbates exposure. In India alone, coal-fired power plants contribute to over 115,000 annual deaths from fine particulate pollution, according to the Global Burden of Disease Study (2019). Similarly, China, despite rapid adoption of cleaner technologies, still records approximately 366,000 premature deaths per year linked to coal combustion, with northern provinces (e.g., Shanxi and Hebei) experiencing the highest mortality rates.

    In Eastern Europe, post-industrial transitions have left legacy pollution from aging coal plants. Poland, Europe’s largest coal consumer, faces 15,000–20,000 annual deaths from coal-related air pollution, with Katowice and Silesia identified as critical hotspots. Bulgaria and Romania also report elevated mortality rates due to outdated power plants and inadequate filtration systems. Conversely, North America and Western Europe have seen reductions in coal-related deaths due to stricter emissions regulations (e.g., EPA’s Mercury and Air Toxics Standards) and phased retirements of coal plants, though Appalachia (USA) and Rhineland (Germany) still experience localized health burdens.

    Long-Term Ecological Consequences of Coal Mining

    Beyond atmospheric pollution, coal mining inflicts lasting damage on terrestrial and aquatic ecosystems through land subsidence, water contamination, and biodiversity loss. One of the most persistent environmental hazards is acid mine drainage (AMD), where sulfur-bearing minerals oxidize to form sulfuric acid, lowering pH levels in nearby water bodies. This process mobilizes heavy metals (e.g., aluminum, manganese), rendering water toxic to aquatic life and unsuitable for agriculture. In Appalachia (USA), AMD has rendered over 2,000 miles of streams uninhabitable, with West Virginia’s Buffalo Creek flood (1972) serving as a tragic case study of industrial negligence leading to 125 deaths and long-term ecological collapse.

    Mountaintop removal mining, prevalent in Appalachia and China’s Shanxi province, involves blasting entire summits to access coal seams, resulting in massive sediment runoff that buries valleys and streams. This practice has destroyed over 500 mountains in the U.S. since the 1970s, while in China, coal mining has altered 1.6 million hectares of land, displacing millions of hectares of forest cover. Groundwater depletion is another critical issue, as deep coal mining depletes aquifers, exacerbating water scarcity in arid regions like India’s Jharkhand state and Australia’s Bowen Basin.

    Environmental Footprint Comparison: Coal vs. Natural Gas vs. Biomass

    When evaluated across their lifecycle emissions, coal exhibits the highest environmental impact among conventional fossil fuels, surpassing both natural gas and biomass in key metrics. A 2021 study by the Intergovernmental Panel on Climate Change (IPCC) quantifies coal’s carbon intensity at 921 kg CO₂ per MWh, compared to 490 kg CO₂ for natural gas and variable emissions for biomass (ranging from 10–100 kg CO₂/MWh if sustainably sourced). However, biomass combustion releases particulate matter and nitrogen oxides (NOₓ) at levels comparable to coal, particularly when agricultural residues or low-quality wood are burned inefficiently.

    Natural gas, while cleaner in terms of CO₂ emissions per unit energy, still contributes to methane leaks (CH₄), a potent greenhouse gas with 84–86 times the warming potential of CO₂ over 20 years. Coal’s advantage in energy density is offset by its higher sulfur and mercury content, which necessitates costly scrubbing technologies that are often absent in developing economies. Biomass, if managed sustainably, can achieve near-zero net emissions through carbon sequestration in regrowing forests, but deforestation-driven biomass (e.g., palm oil waste in Indonesia) can worsen climate impacts by reducing carbon sinks.

    Social Costs of Coal: Displacement, Water Rights, and Economic Dependence

    The socioeconomic impacts of coal extend beyond health and ecology, manifesting in community displacement, resource conflicts, and economic vulnerability. Coal mining operations frequently relocate indigenous and rural populations, often without adequate compensation or resettlement support. In India’s Singrauli region, over 50,000 people have been displaced since the 1970s, with many left in slums lacking basic services. Similarly, China’s Three Gorges Dam and coal mines have displaced 1.3 million people, creating social unrest in areas like Sichuan and Guizhou.

    Water rights conflicts arise where coal companies divert rivers for mining operations or contaminate groundwater, leading to agricultural losses and public health crises. In South Africa’s Mpumalanga province, coal-fired power plants have depleted local water tables, while in Colombia, drilling for coal has poisoned rivers, forcing communities to rely on expensive bottled water. Economically, regions dependent on coal face structural unemployment as global transitions away from fossil fuels accelerate. Germany’s Ruhr Valley and Pennsylvania’s anthracite region (USA) exemplify the deindustrialization trauma following coal plant closures, with high poverty rates and brain drain persisting decades after mine shutdowns.

    The social cost of coal—encompassing healthcare expenditures, lost productivity, and ecosystem services—has been estimated at $5–$8 trillion annually by the World Bank and International Monetary Fund (IMF), far exceeding the $1–$2 trillion in revenue generated by the coal industry. This disparity underscores the uneven distribution of costs and benefits, where local communities bear the pollution burdens while global corporations and governments retain economic gains.

    Coal’s legacy is one of duality: a potent energy source that fueled the Industrial Revolution yet remains a symbol of environmental and health crises in the 21st century. While its high energy density and reliability sustain critical industries, the pollutants it releases—from particulate matter to greenhouse gases—demand urgent innovation in cleaner alternatives and carbon mitigation strategies. As the world transitions toward renewable energy, coal’s role persists in regions dependent on its affordability and scalability, underscoring the need for balanced policies that address both energy security and sustainability. Understanding coal’s full spectrum—from formation to combustion to consequence—provides the foundation for shaping a more resilient and sustainable energy future.

    FAQ

    What is coal primarily used for in industries and daily life?

    Coal is mainly used as a fuel for electricity generation, heating, and industrial processes like steel production. It’s also burned in homes for warmth, used in manufacturing (e.g., cement, chemicals), and historically powered steam engines and trains.

    Which type of coal is best for barbecuing (BBQ)?

    Lump charcoal (made from natural hardwood coal) is best for BBQ because it burns hotter and cleaner than briquettes, producing fewer chemicals and ash. Avoid softwood or treated charcoals, which can impart bad flavors or release toxins.

    What kind of coal do blacksmiths typically use for forging?

    Blacksmiths primarily use bituminous coal or coke (a refined coal derivative) because they burn hotter and longer than other types, providing consistent heat for hammering and shaping metal. Anthracite is also used but less common due to its slower burn rate.

    What is coal made of chemically?

    Coal is a sedimentary rock formed from decomposed plant matter over millions of years, primarily composed of carbon (50–90%), along with hydrogen, oxygen, nitrogen, sulfur, and trace minerals. Its exact composition varies by type (lignite, sub-bituminous, bituminous, anthracite).

    What type of coal is needed for Chaos Infusion in Diablo or similar games?

    In games like Diablo, Chaos Infusion typically requires Chaos Orbs (not actual coal), but if referring to a real-world analogy (e.g., RuneScape), it uses coal blocks (a game resource) to craft Chaos runes. Check the specific game’s lore or mechanics for exact details.

    What type of coal was used to fuel steam engines?

    Steam engines primarily burned bituminous coal or anthracite because they produce high heat and sustained energy. Bituminous coal was more common in early engines due to its abundance and moderate burn rate, while anthracite was preferred later for cleaner, longer burns.

    Leave a Comment

    Comments are moderated before appearing. The data you submit is processed according to the Privacy Policy of Voltefac.