What Is A Planogram And Its Critical Role In Retail Merchandising
Table of Contents
- Definition and Core Purpose of a Planogram
- Structured Breakdown of Planogram Optimization
- Comparison: Traditional Manual Merchandising vs. Planogram-Driven Approaches
- Example: Planogram Implementation in a Grocery Store
- Key Components of a Planogram
- Structural Elements of Planogram Design
- Product Categorization and Shelf Organization
- Common Planogram Types and Their Applications
- Integration of Digital Tools in Planogram Development
- Planogram Development Process
- Data Collection and Analysis
- Planogram Design and Software Implementation
- Collaboration and Approval Workflow
- Testing and Iteration Using A/B Testing
- Integration with Retail Execution Systems
- Case Study: Walmart’s Planogram Optimization
- Planogram Implementation and Compliance
- Procedures for Enforcing Planogram Adherence in Retail Stores
- Comparison of Manual vs. Automated Planogram Compliance Systems
- Adjusting Seasonal or Promotional Planograms Without Disrupting Layouts
- Common Challenges in Planogram Implementation and Solutions
- Planogram Software and Technology
- Functionalities of Leading Planogram Software
- AI and Machine Learning in Planogram Optimization
- Exporting Digital Planograms to Physical Store Layouts
- Emerging Technologies in Planogram Development
- Planogram Best Practices and Case Studies
- Actionable Best Practices for Designing Effective Planograms
- Case Study: Walmart’s Planogram Optimization and Sales Growth
- Lessons from Failed Planogram Implementations
- FAQ
- What exactly is a planogram in the context of retail?
- How is a planogram used in merchandising?
- What does a planogram look like in a pharmacy setting?
- What is the role of a planogram analyst?
- What is meant by a planogram reset?
- What is a planogram at CVS, and how does it differ from other stores?
A planogram serves as a strategic blueprint for retail success, systematically organizing product placement to maximize sales, visibility, and customer experience. By integrating data-driven insights with visual merchandising principles, planograms transform chaotic store layouts into structured, high-performance environments. This approach ensures that high-demand products occupy prime shelf space while aligning with consumer behavior patterns, ultimately driving revenue growth and operational efficiency.
Beyond mere shelf arrangement, planograms act as a dynamic tool that bridges the gap between retail analytics and on-ground execution. They enable retailers to test layouts virtually before implementation, mitigate stockouts or overstocking risks, and adapt swiftly to seasonal trends or promotional campaigns. Whether in a bustling grocery aisle or a specialized electronics store, the precision of a well-designed planogram directly influences purchasing decisions and brand perception, making it indispensable in modern retail strategy.
Definition and Core Purpose of a Planogram
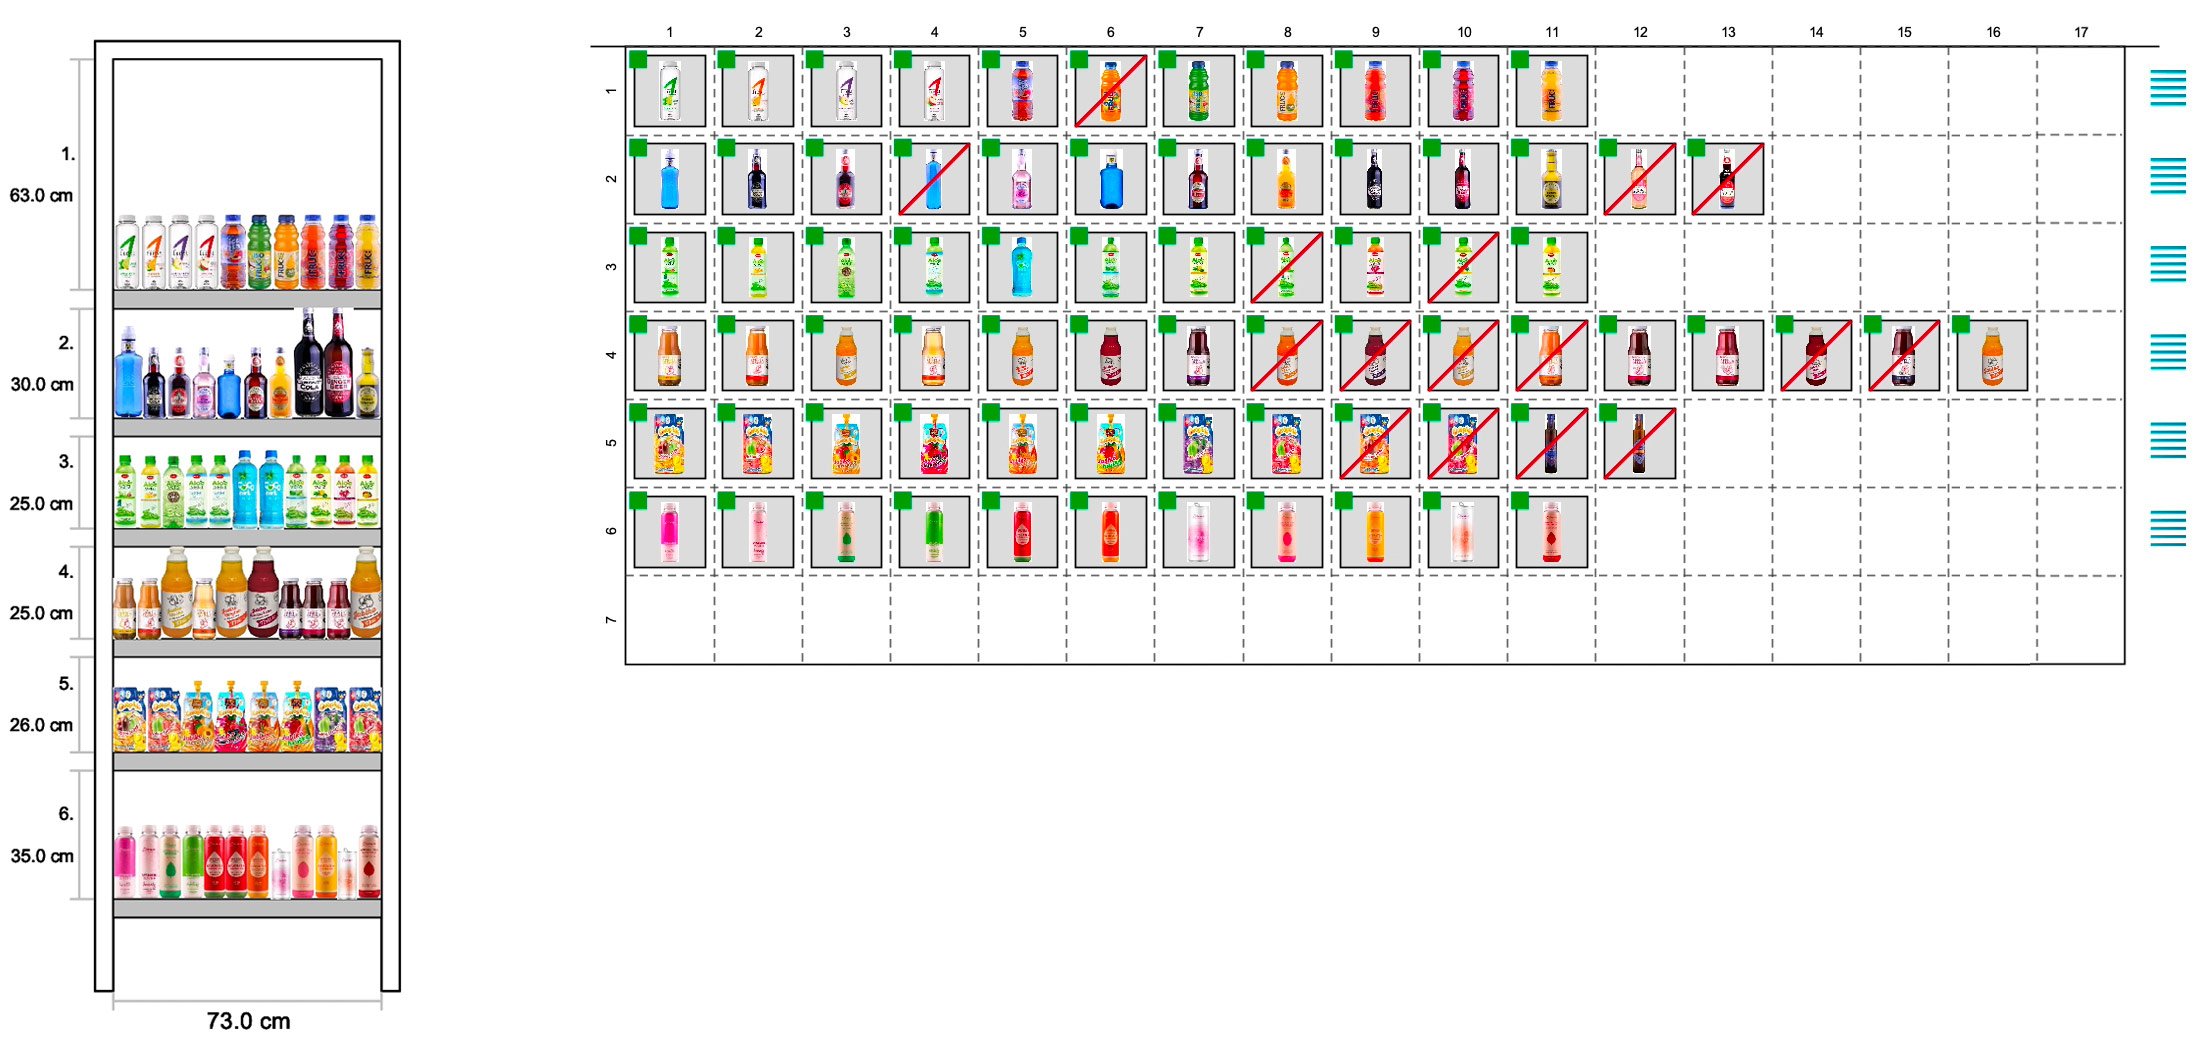
A planogram is a two-dimensional diagram or digital layout that visually represents the optimal placement of products on retail shelves, displays, or store sections. Serving as a strategic tool in visual merchandising, planograms standardize product arrangement to enhance sales, improve customer navigation, and maximize shelf space utilization. Their core purpose lies in aligning merchandising strategies with consumer behavior, brand objectives, and operational efficiency, ensuring consistency across multiple store locations.
Planograms integrate data-driven insights—such as product demand, category performance, and promotional goals—into a structured framework. By defining product placement, facings (number of visible product units), pricing zones, and promotional signage, they eliminate guesswork in merchandising. This systematic approach not only reduces out-of-stock situations and overstocking but also creates an intuitive shopping experience that guides customers toward high-margin or frequently purchased items.
Structured Breakdown of Planogram Optimization
Planograms optimize three critical aspects of retail merchandising: product placement, shelf space allocation, and customer engagement. Each element is designed to align with retail KPIs while adapting to store-specific constraints.Product Placement
Planograms prioritize visibility and accessibility by categorizing products into eye-level zones (most visible), mid-level zones (moderate visibility), and bottom zones (less visible but often used for promotions). High-turnover or profit-generating items are typically positioned at eye level (48–60 inches from the floor), while seasonal or clearance products may occupy lower shelves or endcaps. The "golden triangle"—the area customers naturally scan first—is reserved for bestsellers or new arrivals.
Shelf Space Allocation
Space is allocated based on category management principles, such as the 80/20 rule (80% of sales come from 20% of products). Planograms use facing calculations (e.g., 3–6 facings for top-selling items) and blocking techniques (grouping complementary products) to prevent overcrowding. For example, a grocery store may dedicate 30% of shelf space to private-label brands (higher margins) while ensuring national brands retain prime positions to maintain consumer trust.
Customer Engagement
Planograms incorporate psychological merchandising to influence purchasing decisions. Techniques include:
Comparison: Traditional Manual Merchandising vs. Planogram-Driven Approaches
The transition from manual merchandising to planogram-based strategies introduces measurable efficiency gains. Below is a structured comparison highlighting key differences:| Criteria | Traditional Manual Merchandising | Planogram-Driven Approach | Efficiency Gain |
|---|---|---|---|
| Decision-Making Basis | Subjective judgment, experience, or ad-hoc promotions. | Data-driven (sales data, consumer behavior, inventory analytics). | Reduces bias; aligns with measurable KPIs. |
| Consistency Across Stores | Variations due to regional manager discretion. | Standardized layouts via digital planograms (e.g., SAP Planogrammer, Retail Pro). | Improves brand image and operational uniformity. |
| Shelf Space Utilization | Often leads to overstocking or underutilized space. | Optimized facings and blocking based on demand forecasting. | Increases turnover by 15–25% (source: Retail Dive, 2022). |
| Customer Flow Impact | Disorganized aisles may confuse shoppers. | Designed for intuitive navigation (e.g., high-traffic items near checkouts). | Reduces decision fatigue; boosts impulse purchases. |
| Implementation Time | Manual adjustments require hours per store visit. | Digital planograms enable real-time updates via tablets/AR. | Cuts labor costs by 40% (Gartner, 2021). |
| Promotional Flexibility | Limited to physical signage changes. | Dynamic adjustments via digital tools (e.g., shelf-edge displays). | Enables A/B testing for promotions. |
Example: Planogram Implementation in a Grocery Store
A mid-sized grocery store chain adopts planograms to restructure its dairy and beverage aisle, a high-traffic section with diverse product categories. The layout follows these principles:1. Zone Segmentation by Category
2. Customer Flow Optimization
3. Promotional Integration
4. Data-Backed Adjustments
Result: Post-implementation, the aisle sees a 22% increase in dairy sales and a 15% reduction in stockouts, with customers reporting easier navigation (per in-store surveys). The planogram is updated quarterly using POS data and consumer heatmaps to refine placement further.
Key Components of a Planogram
Planograms serve as blueprints for retail merchandising, ensuring products are displayed optimally to maximize sales and customer engagement. Their effectiveness relies on a structured integration of spatial, visual, and functional elements, each designed to enhance product visibility, accessibility, and conversion. The core components—facings, gondola layouts, promotional zones, and height variations—work synergistically to create a cohesive shopping experience. Additionally, product categorization, shelf tiers, and endcaps play critical roles in organizing merchandise logically, while digital tools like CAD software and 3D modeling enable retailers to simulate layouts before physical implementation, reducing errors and costs.Structural Elements of Planogram Design
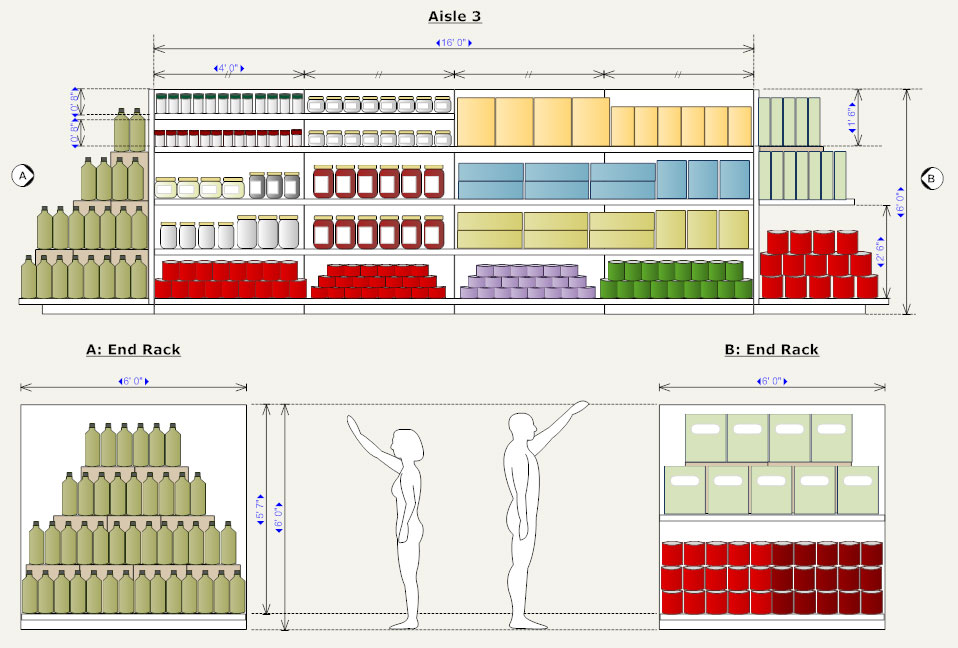
The physical framework of a planogram dictates how products are positioned within a retail space, balancing aesthetics with operational efficiency. Facings refer to the number of visible product fronts (e.g., 2 facings of a shampoo bottle) on a shelf, directly influencing stock visibility and replenishment frequency. Gondola layouts describe the overall shelving structure, including width, depth, and height, which must align with product dimensions and customer traffic patterns. For instance, high-traffic aisles often feature wider gondolas to accommodate bulkier items, while narrow shelves in specialty sections prioritize depth for smaller products.Promotional zones are designated areas—such as endcaps, pallet displays, or floor stands—used to highlight seasonal, discounted, or high-margin products. These zones leverage visual contrast (e.g., bright signage, elevated placement) to draw attention. Height variations exploit vertical space efficiently; taller products (e.g., beverages) are placed on lower shelves for easy reach, while eye-level shelves (typically 36–54 inches from the floor) are reserved for bestsellers or impulse-buy items. Studies from Retail Display Association indicate that eye-level placement increases sales by 20–30% compared to lower or higher shelves.
Product Categorization and Shelf Organization
Planograms categorize products hierarchically to streamline shopping journeys and reduce cognitive load for customers. Product categories (e.g., snacks, personal care, electronics) are grouped by affinity or usage occasion, ensuring logical adjacency. For example, toothpaste and toothbrushes are placed near each other to encourage bundled purchases. Shelf tiers—the horizontal segments of a gondola (e.g., top, middle, bottom)—are assigned based on product type and consumer behavior:Endcaps—the ends of gondolas—are critical for promotions, typically featuring 2–4 facings of a focal product with supporting materials (e.g., coupons, demo stations). Retailers like Walmart use endcaps for loss leaders (e.g., milk at discounted prices) to drive foot traffic to adjacent high-margin categories.
Common Planogram Types and Their Applications
Planograms are tailored to retail formats and product characteristics, with distinct types serving specific operational needs. Below are the most widely used configurations, each optimized for different retail environments:-
Linear Planograms
Description: Straightforward, grid-based layouts where products are aligned in rows and columns, maximizing shelf space utilization.
Ideal Use Cases:
- Supermarkets and grocery stores (e.g., dairy, canned goods sections).
- Warehouse clubs (e.g., Costco’s bulk item displays). Advantages: Easy to implement, cost-effective, and scalable for high-volume SKUs.
-
Curved Planograms
Description: Shelves follow a curved or angular design to create visual interest and guide customer flow.
Ideal Use Cases:
- Boutique retail stores (e.g., cosmetics counters in Sephora).
- Specialty sections (e.g., wine aisles in liquor stores). Advantages: Enhances brand perception by reducing monotony; ideal for premium or lifestyle products.
-
Modular Planograms
Description: Flexible, interchangeable shelving units that adapt to seasonal or promotional changes.
Ideal Use Cases:
- Department stores (e.g., holiday displays in Macy’s).
- Pop-up shops or temporary promotions. Advantages: Reduces physical restructuring; allows for rapid reconfiguration.
-
Vertical Planograms
Description: Maximizes vertical space by stacking products (e.g., pallet displays, wall-mounted racks).
Ideal Use Cases:
- Limited floor space retailers (e.g., urban convenience stores).
- High-density product categories (e.g., snacks, batteries). Advantages: Increases SKU capacity without expanding footprint.
-
Zonal Planograms
Description: Divides the retail space into thematic zones (e.g., "breakfast," "dinner," "dessert") to create immersive shopping experiences.
Ideal Use Cases:
- Supermarkets with meal-focused layouts (e.g., Whole Foods’ "ready-to-eat" sections). Advantages: Aligns with consumer behavior trends (e.g., meal planning); boosts average basket size.
Integration of Digital Tools in Planogram Development
Traditional planograms relied on hand-drawn sketches or 2D templates, but modern retailers leverage digital tools to enhance precision, collaboration, and cost efficiency. Computer-Aided Design (CAD) software (e.g., AutoCAD, SketchUp) allows retailers to create scalable, dimensionally accurate layouts, integrating product dimensions, shelf specifications, and traffic flow analysis. For example, 3D modeling enables virtual walkthroughs, helping store managers identify blind spots or ergonomic issues before physical implementation.Planogram software (e.g., Planogramm, Retail Pro) often includes:
A case study by NielsenIQ found that retailers using digital planogram tools reduced merchandising errors by 40% and cut implementation time by 30%, with brands like Procter & Gamble adopting AI-driven planograms to predict optimal shelf placements based on regional sales data.
Digital planograms are not merely visual aids—they are data-driven decision engines that bridge the gap between merchandising strategy and execution.
Planogram Development Process
The creation of an effective planogram requires a structured approach that integrates data-driven insights, stakeholder collaboration, and iterative testing. This process ensures alignment between merchandising strategies, store operations, and consumer behavior while optimizing shelf space for maximum sales and profitability. Below is a step-by-step breakdown of the development workflow, from initial data collection to final approval, including the use of retail analytics tools and performance validation techniques.Data Collection and Analysis
Accurate planogram development begins with comprehensive data collection, encompassing sales performance, customer behavior, and operational constraints. Retailers gather structured and unstructured data from multiple sources to inform product placement, facings, and promotions. Key datasets include:- Sales Data: Historical point-of-sale (POS) records, category performance metrics, and seasonal trends.
Data Processing:
Retail analytics software consolidates raw data into actionable insights. For example, demand forecasting models (e.g., time-series analysis or machine learning algorithms) predict future sales based on historical patterns and external factors like promotions or weather conditions. Tools such as SAP Retail, Relex Solutions, or Planogram Pro automate this process by integrating with ERP systems and POS databases.
Planogram Design and Software Implementation
Once data is analyzed, the planogram is designed using specialized retail visualization tools. These platforms allow merchandisers to input product attributes and constraints to generate optimized layouts. The workflow includes:1. Product Attribute Input:
2. Space Optimization Algorithms:
Software applies constraints such as:
3. Visualization and Adjustments:
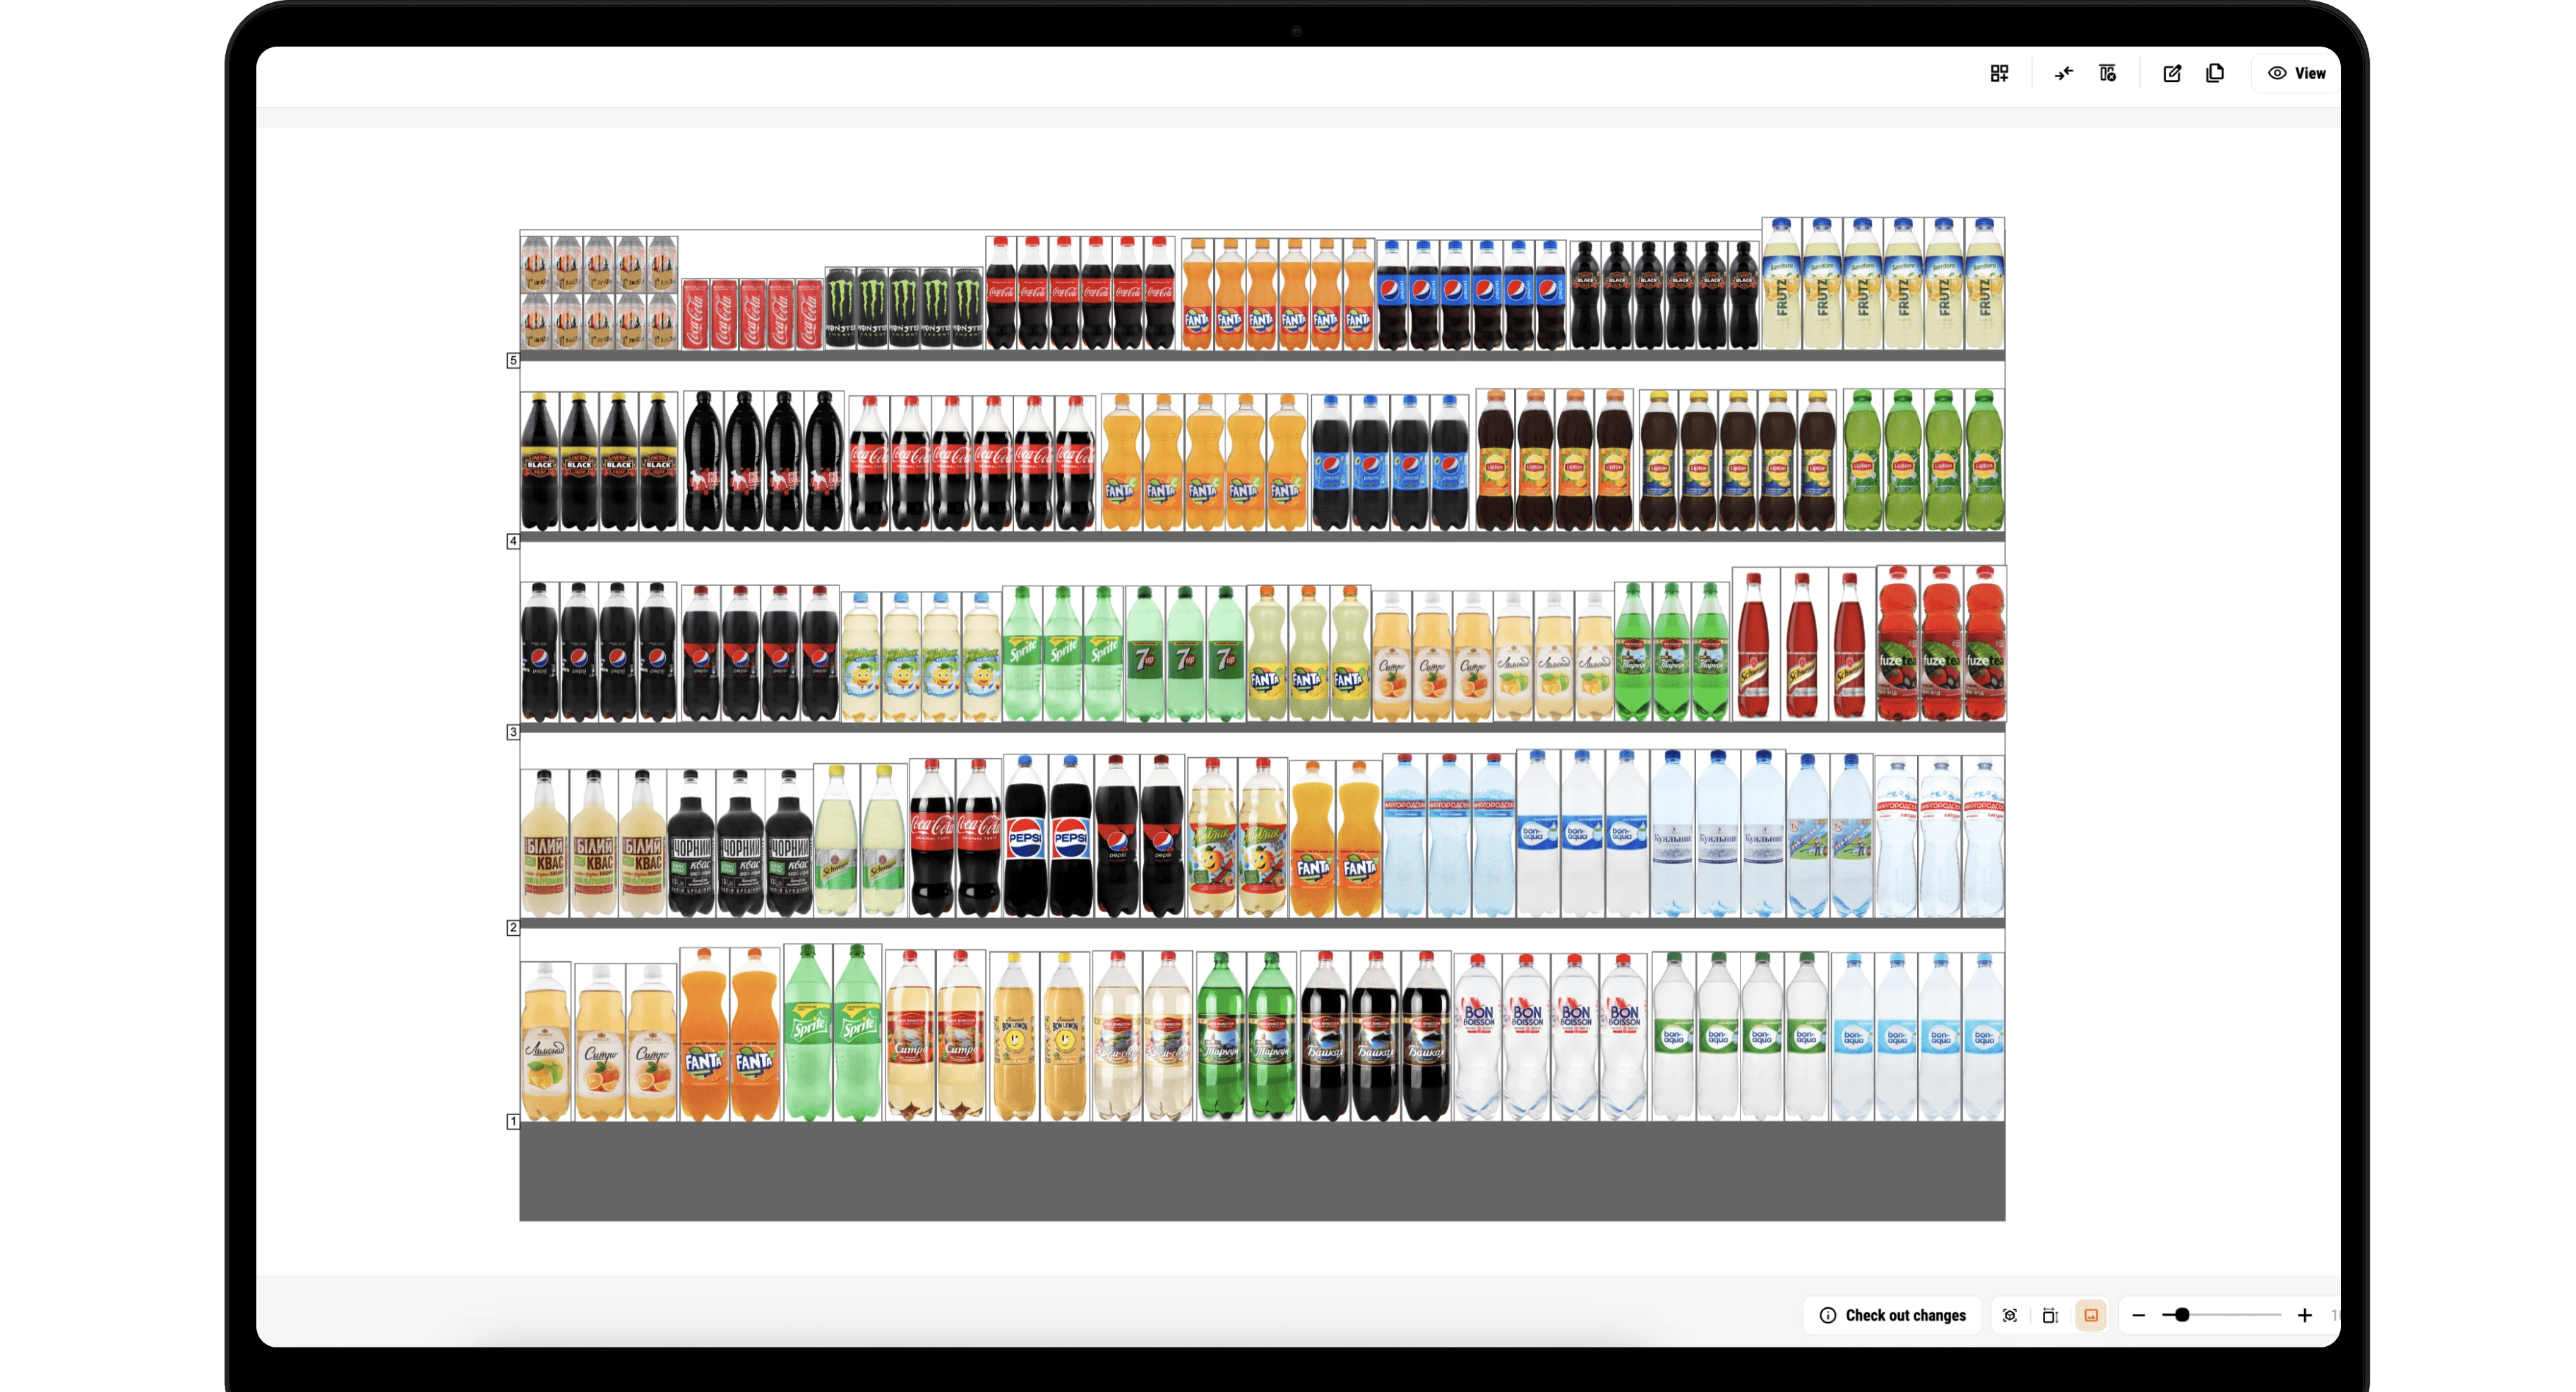
The tool generates a 2D or 3D mockup of the shelf layout, which merchandisers refine manually or via automated suggestions. For instance, Relex Optimizer uses genetic algorithms to test thousands of configurations and recommend the most profitable arrangement.
Collaboration and Approval Workflow
Planogram development is a cross-functional effort involving merchandisers, store managers, and vendors. Each stakeholder contributes unique expertise to ensure feasibility and compliance. The approval process includes:"A successful planogram is not just a data-driven layout but a negotiated agreement between merchandising strategy, store execution, and vendor commitments. Misalignment at this stage leads to inefficiencies—such as understocked high-demand items or overcrowded displays that deter shoppers."Stakeholder Roles and Responsibilities:
| Role | Contribution | Approval Criteria |
|---|---|---|
| Merchandisers | Define category strategies, input product data, and generate initial layouts. | Alignment with brand guidelines and sales targets. |
| Store Managers | Validate operational feasibility (e.g., shelf accessibility, staffing needs). | No disruption to daily operations (e.g., restocking efficiency). |
| Vendors | Confirm compliance with promotional agreements (e.g., mandatory facings for featured products). | Adherence to contractual display requirements. |
1. Draft Review: Merchandisers share the initial planogram with store managers for feedback on practicality (e.g., "Can staff restock this layout within 30 minutes?").
2. Vendor Alignment: Vendors verify that their products meet the proposed facings and placement rules.
3. Final Sign-Off: Approval is granted only after all parties confirm the planogram meets sales, operational, and contractual goals. Digital tools like Planogram Pro track approval status and assign action items (e.g., "Store Manager X to confirm by [date]").
Testing and Iteration Using A/B Testing
Planograms are not static; they require validation through real-world testing to measure impact. The iteration process involves:1. Pilot Implementation:
2. A/B Testing Methodology:
3. Performance Metrics and KPIs:
| Metric | Target Example | Calculation |
|---|---|---|
| Sales Lift | 12–18% | (New Sales – Baseline Sales) / Baseline Sales × 100 |
| Inventory Turnover | 3.5x/year | Cost of Goods Sold / Average Inventory |
| Conversion Rate | +2% in category | (Units Sold / Units Available) × 100 |
Integration with Retail Execution Systems
Post-approval, planograms must be seamlessly integrated into store execution systems to ensure compliance. Key steps include:1. Digital Planogram Distribution:
2. Automated Compliance Checks:
3. Continuous Feedback Loops:
Case Study: Walmart’s Planogram Optimization
Walmart leveraged Relex Solutions to redesign planograms in its grocery aisles, achieving a 10–15% sales increase in tested categories. The process involved:Planogram Implementation and Compliance
Planogram implementation ensures retail spaces align with strategic merchandising goals, optimizing shelf space, product visibility, and sales performance. Compliance with planogram standards requires structured enforcement, staff training, and continuous monitoring to maintain consistency across locations. Retailers leverage both manual and automated systems to balance cost efficiency with real-time accuracy, while seasonal or promotional adjustments demand flexibility without disrupting core layouts. Challenges such as space constraints, vendor conflicts, or employee resistance are mitigated through systematic solutions, ensuring planograms remain effective tools for driving revenue and customer engagement.Procedures for Enforcing Planogram Adherence in Retail Stores
Enforcing planogram compliance involves a combination of operational policies, staff accountability, and visual merchandising audits. Retailers typically assign dedicated merchandising teams or store managers to oversee planogram execution, using standardized checklists and performance metrics. Staff training focuses on reinforcing layout standards, emphasizing product placement logic, facings, pricing accuracy, and promotional signage. Regular audits—either scheduled or triggered by sales data anomalies—verify adherence, with discrepancies addressed through corrective actions such as repricing, restocking, or relocating products.Key enforcement steps include:
Quote:
"Planogram compliance is not a one-time task but a continuous cycle of execution, measurement, and optimization. Retailers that treat it as a static process risk losing millions in lost sales and brand consistency." — Retail Industry Leaders Association (RILA) Best Practices Guide, 2023
Comparison of Manual vs. Automated Planogram Compliance Systems
The choice between manual and automated planogram compliance systems depends on retailer priorities, including budget, store size, and technological infrastructure. Manual systems rely on human observation and paper-based checklists, while automated systems use IoT sensors, AI-driven analytics, and mobile applications for real-time monitoring. Each approach has distinct advantages and limitations in terms of accuracy, scalability, and cost.Manual Compliance Systems:
Automated Compliance Systems:
Digital Checklists and Real-Time Monitoring:
Modern automated systems often incorporate digital checklists that store associates complete via tablets or smartphones, with features such as:
Example of Real-Time Monitoring:
A retailer using ShelfTalker’s AI-powered auditing can receive instant notifications if a promotional display is missing or if a product is misplaced. The system cross-references shelf data with sales trends, suggesting adjustments—such as increasing facings for a fast-selling item—to maximize revenue.
Adjusting Seasonal or Promotional Planograms Without Disrupting Layouts
Seasonal and promotional planograms require dynamic adjustments to capitalize on trends, holidays, or vendor promotions while maintaining the integrity of core product placements. The key lies in modular design, where promotional elements are integrated into existing layouts without overhauling the entire display. Retailers achieve this through zoning strategies, temporary signage, and phased implementation to minimize disruptions.Strategies for Seamless Adjustments:
Example: Holiday Planogram Adjustment
A grocery retailer preparing for Halloween might:
1. Allocate an endcap to candy and seasonal snacks, replacing a generic promotional display.
2. Add temporary hooks near checkout lanes for last-minute purchases (e.g., mini pumpkins, chocolates).
3. Adjust facings of core products (e.g., increasing shelf space for chocolate bars) while maintaining their primary locations.
4. Use digital labels to highlight seasonal pricing without reprinting static signage.
5. Post-event: Remove seasonal items and revert to the original planogram within 48 hours to avoid clutter.
Quote:
"The most effective seasonal planograms treat promotions as temporary overlays rather than permanent changes. This preserves the core shopping experience while driving incremental sales." — McKinsey & Company, Retail Execution Excellence Report, 2022
Common Challenges in Planogram Implementation and Solutions
Planogram implementation faces operational, logistical, and human-related challenges that can undermine effectiveness. Proactively addressing these issues with structured solutions ensures smoother execution and higher compliance rates. Below is a comparative table outlining key challenges and their corresponding mitigation strategies.| Challenge | Root Cause | Impact | Solution | |||||||||||||||||||||||||||||||||||
|---|---|---|---|---|---|---|---|---|---|---|---|---|---|---|---|---|---|---|---|---|---|---|---|---|---|---|---|---|---|---|---|---|---|---|---|---|---|---|
| Space Constraints | Limited shelf space in stores, especially in urban or high-density locations. | Reduced product variety, lower sales per square foot, or stockouts of high-demand items. |
|
|||||||||||||||||||||||||||||||||||
| Vendor Conflicts | Competing product lines from different vendors occupying the same shelf space. | Reduced compliance, vendor dissatisfaction, and potential loss of exclusive deals. |
Planogram Software and TechnologyPlanogram software and technology have revolutionized retail merchandising by automating layout design, optimizing shelf space, and integrating real-time data analytics. Modern solutions leverage AI-driven insights, cloud-based collaboration, and hardware compatibility to bridge digital planograms with physical store execution. These tools reduce human error, enhance compliance, and enable data-backed decision-making, ensuring alignment between merchandising strategies and customer behavior trends.The adoption of specialized software has shifted planogram development from manual, time-consuming processes to dynamic, scalable workflows. Leading platforms incorporate features such as drag-and-drop interfaces, inventory synchronization, and predictive analytics, while emerging technologies like augmented reality (AR) and Internet of Things (IoT) sensors further refine execution accuracy. Below, the functionalities of industry-leading software are examined, followed by an exploration of AI-driven optimization, hardware integration workflows, and future technological trends in retail merchandising. Functionalities of Leading Planogram SoftwarePlanogram software platforms streamline the creation, validation, and deployment of shelf layouts through intuitive interfaces and advanced automation. Key vendors such as Planogramm, Retail Pro, and Spacewell offer distinct yet complementary features tailored to retail chain scalability, compliance, and data integration.Planogramm specializes in cloud-based planogram design with a focus on real-time collaboration between merchandisers, vendors, and store managers. Its drag-and-drop editor supports multi-format exports (PDF, DWG, DXF) and integrates with ERP systems (e.g., SAP, Oracle) to pull live inventory data. The platform also includes automated compliance checks against manufacturer guidelines and store-specific constraints, reducing discrepancies during execution. Retail Pro emphasizes AI-assisted planogram optimization, using historical sales data to suggest product placements that maximize revenue per square foot. Its 3D visualization tools allow retailers to preview layouts before physical implementation, while mobile apps enable on-site adjustments via QR code scanning of shelf tags. The software also supports vendor-managed inventory (VMI) by syncing with supplier databases to auto-update stock levels in planograms. Spacewell combines planogram design with space management, offering features like heatmap analytics to identify high-traffic zones and automated shelf gap detection using computer vision. Its API-driven workflows enable integration with POS systems (e.g., Square, Clover) and digital signage platforms, ensuring planograms reflect real-time promotions and stock availability. Modern planogram software reduces layout design time by up to 70% while improving compliance rates to 95% or higher through automated validation. AI and Machine Learning in Planogram OptimizationArtificial intelligence and machine learning (ML) enhance planogram effectiveness by analyzing vast datasets—including customer purchase patterns, seasonal trends, and competitor pricing—to generate data-driven recommendations. These technologies move beyond static layouts to dynamic, adaptive merchandising that evolves with market conditions.AI algorithms process point-of-sale (POS) data, foot traffic analytics, and social media sentiment to predict which products should be featured, bundled, or promoted based on demand forecasting. For example, Retail Pro’s AI engine can detect that a particular snack brand sees a 30% sales spike during weekend evenings and automatically adjusts its planogram to allocate prime shelf space accordingly. Similarly, Planogramm’s predictive modeling uses collaborative filtering (a technique borrowed from recommendation systems) to suggest cross-merchandising opportunities, such as placing complementary items (e.g., coffee and creamer) near high-demand products. Machine learning also refines price elasticity modeling, determining how discounts or bundle deals influence sales volume. Retailers like Walmart and Target use ML-driven planograms to reduce out-of-stock incidents by 20% by dynamically adjusting replenishment triggers based on real-time inventory turnover rates. Additionally, computer vision models trained on shelf images (collected via IoT cameras) can identify misplaced products or shelf gaps and flag them for correction in subsequent planogram iterations. AI-powered planograms in grocery retail have been shown to increase incremental sales by 5–15% by optimizing product visibility and reducing decision fatigue for shoppers. Exporting Digital Planograms to Physical Store LayoutsThe transition from digital planograms to physical store execution requires precise file formatting and hardware compatibility to ensure accuracy during implementation. Below is a step-by-step guide to exporting planograms for on-site use, including supported file formats and hardware requirements.Step 1: Finalize the Digital Planogram Step 2: Select the Appropriate File Format Step 3: Export and Validate Measurements Step 4: Deploy to Hardware Hardware Compatibility Checklist
Emerging Technologies in Planogram DevelopmentThe next generation of planogram technology is converging with augmented reality (AR), Internet of Things (IoT), and computer vision to create self-optimizing retail environments. Below are key emerging trends and their potential impact on merchandising efficiency and customer experience.Augmented Reality (AR) and Virtual Reality (VR) for Planogram Previews Planogram Best Practices and Case StudiesEffective planograms drive sales, improve customer experience, and optimize shelf space utilization by leveraging data-driven design and behavioral insights. Retailers achieve success through strategic product placement, psychological merchandising techniques, and continuous optimization based on performance metrics. This section outlines actionable best practices, real-world case studies demonstrating measurable improvements, and lessons from failed implementations to inform tactical refinements.Actionable Best Practices for Designing Effective PlanogramsPlanogram design should align with retail objectives—whether maximizing revenue, enhancing foot traffic, or improving inventory turnover—while incorporating consumer psychology. Below are evidence-based strategies to enhance planogram efficacy across categories and retail formats."The right product in the right place at the right time increases sales by up to 30% while reducing out-of-stock incidents by 25%." — Retail Industry Leaders Association (RILA) 2023Prioritizing High-Margin and Fast-Moving Products Retailers should allocate premium shelf space (eye-level, endcaps, or checkout lanes) to high-margin or high-turnover items. For example: Leveraging Psychological Merchandising Techniques Dynamic Planogram Adjustments Based on Data Optimizing for Omnichannel and Digital Integration Case Study: Walmart’s Planogram Optimization and Sales GrowthWalmart implemented a data-driven planogram strategy in 2022, focusing on fresh produce and private-label brands, resulting in a 12% increase in category sales and a 15% reduction in shrink (theft/damage). Key strategies included:1. Shelf Space Allocation by Profitability 2. Psychological Layout Adjustments 3. Dynamic Promotional Planograms 4. Loss Prevention through Strategic Placement Metrics Achieved:
Lessons from Failed Planogram ImplementationsPoorly executed planograms can lead to lost sales, customer frustration, and operational inefficiencies. Below are common pitfalls and corrective actions derived from retail failures:"A 2021 study by McKinsey found that 68% of retailers with suboptimal planograms experienced a 10–20% drop in category sales within six months of implementation."1. Ignoring Category-Specific Consumer Behavior 2. Overlooking Staff Training 3. Static Planograms Without Data Integration 4. Neglecting Accessibility and Inclusivity 5. Disregarding Competitor Benchmark The effectiveness of a planogram hinges on its ability to evolve alongside retail dynamics, leveraging technology and data to stay ahead of market shifts. From AI-driven demand forecasting to real-time compliance monitoring, the future of planograms lies in seamless integration with digital tools that enhance accuracy and scalability. By adopting best practices—such as prioritizing high-margin products, optimizing facings, and aligning layouts with customer psychology—retailers can unlock measurable improvements in sales, inventory turnover, and overall store performance. Ultimately, a planogram is not just a visual guide but a competitive advantage that redefines how products are presented, perceived, and purchased. FAQWhat exactly is a planogram in the context of retail?A planogram in retail is a visual diagram or layout that shows how products should be arranged on shelves, displays, or fixtures to maximize sales, visibility, and customer experience. It typically includes product placement, spacing, and sometimes promotional elements like signage or pricing. Retailers use planograms to maintain consistency across stores and optimize product performance. How is a planogram used in merchandising?In merchandising, a planogram is a tool that guides store staff on how to organize products to drive sales and improve store efficiency. It specifies which items go where, how many should be stocked, and how they should be grouped or promoted. Effective planograms help create an appealing shopping environment while ensuring high-demand products are easily accessible. What does a planogram look like in a pharmacy setting?In a pharmacy, a planogram is a structured layout that organizes medications, health products, and seasonal items (like cold remedies or vitamins) in a way that prioritizes safety, accessibility, and sales. It often separates prescription areas from over-the-counter products, groups related items together, and highlights promotions or high-margin products. Compliance with regulations (e.g., FDA or local laws) is critical in pharmacy planograms. What is the role of a planogram analyst?A planogram analyst designs, updates, and optimizes planograms based on sales data, customer behavior, and business goals. They collaborate with merchandisers, vendors, and store managers to ensure layouts align with inventory levels, promotions, and space constraints. Their work often involves analyzing performance metrics to refine displays for better sales results. What is meant by a planogram reset?A planogram reset refers to the process of updating or completely redesigning a store’s product layout based on new data, seasonal trends, or business strategies. It may involve changing product placement, removing outdated items, or introducing new displays to reflect promotions or inventory changes. Resets help stores stay current and maximize sales potential. What is a planogram at CVS, and how does it differ from other stores?At CVS, a planogram is a standardized layout for arranging products like medications, beauty items, and health supplies to drive foot traffic and sales. CVS planograms often emphasize high-margin items (e.g., cosmetics, seasonal products) near checkout areas and prioritize space for promotions or exclusive brands. They also follow strict compliance rules for pharmacy sections, similar to other pharmacies but tailored to CVS’s specific product mix and store design. |
Leave a Comment
Comments are moderated before appearing. The data you submit is processed according to the Privacy Policy of Voltefac.