| Desert (e.g., Middle East, Australia) |
22–26°C (night cooling critical) |
- Night flushing (opening windows at night to cool thermal mass).
- Evaporative coolers (qanats in Persia, swamp coolers in UAE).
- Thick adobe or stone walls for daytime insulation.
|
- Ancient Persian windcatchers (badgirs), reducing indoor temperatures by 1
Practical Applications and Human Comfort in Room Temperature Management
Optimal room temperature settings are not universal; they vary across residential, commercial, and medical environments due to differing functional requirements, occupant needs, and regulatory standards. While efficiency and energy conservation remain critical, human comfort—defined by physiological, psychological, and environmental factors—serves as the primary benchmark for temperature regulation. This section explores structured decision-making frameworks for temperature control, calibration protocols for measurement accuracy, and observable deviations from comfort zones, paired with evidence-based corrective actions.The interplay between temperature, humidity, air movement, and metabolic activity determines perceived comfort, as established by standards such as ASHRAE 55 and ISO 7730. Deviations from these parameters can lead to discomfort, reduced productivity, or health risks, particularly in sensitive settings like hospitals or laboratories. Below, a systematic approach to temperature management is outlined, integrating technical precision with occupant well-being.
Decision-Making Flowchart for Room Temperature Settings
A standardized flowchart ensures consistency in temperature selection while balancing comfort, efficiency, and regulatory compliance. The process accounts for three primary contexts—residential, commercial, and medical—each with distinct thresholds and priorities.Flowchart Structure:
1. Context Identification
- Classify the setting (residential, commercial, or medical) based on occupancy type, usage hours, and regulatory requirements.
- Example: A residential bedroom requires lower temperatures (18–22°C) compared to a commercial office (22–24°C) or a surgical suite (20–22°C with strict humidity control).
2. Occupant and Activity Analysis
- Assess metabolic heat generation (e.g., sedentary vs. active environments) and vulnerable populations (e.g., elderly, infants, or patients with thermoregulatory disorders).
- Example: A gymnasium may need adjustable zones (18–24°C) due to varying activity levels, while a neonatal unit mandates precise control (24–26°C with humidity at 50–60%).
3. Comfort vs. Efficiency Trade-offs
- Define thresholds where comfort is prioritized (e.g., medical settings) versus efficiency (e.g., unoccupied commercial spaces).
- Key Metrics:
- Residential: Energy savings at 19–21°C (adjustable by season).
- Commercial: Occupied hours at 22–24°C; unoccupied at 16–18°C.
- Medical: Critical care at 20–22°C with ±1°C tolerance; recovery rooms at 23–25°C.
4. Environmental and System Constraints
- Evaluate HVAC capacity, insulation, and external climate data (e.g., heat island effect in urban areas).
- Example: A retrofitted office in a hot climate may require pre-cooling strategies to achieve setpoints without overloading systems.
5. Dynamic Adjustment Protocols
- Implement real-time feedback loops using IoT sensors or occupant surveys to refine settings.
- Example: A smart thermostat in a retail store adjusts based on foot traffic patterns, lowering temperatures during peak hours.
Visual Representation Notes:
The flowchart would depict a diamond-shaped decision tree with branching paths for each context. Key nodes include:
- Input Layer: Context + Occupant Data.
- Processing Layer: Comfort/Efficiency Algorithm.
- Output Layer: Recommended Setpoint ± Tolerance Range.
- Feedback Loop: Sensor Data or User Input → Adjustment.
Calibration Procedure for Room Temperature Measurement
Accurate thermometers are essential for validating room temperature settings, particularly in medical and research environments where deviations can compromise safety or data integrity. Calibration ensures compliance with ISO 9001 and NIST traceability standards, reducing measurement errors (typically ±0.5°C for high-precision instruments).Required Tools:
- Reference thermometer (calibrated to NIST or equivalent standards, e.g., Hart Scientific Model 1504).
- Ice-water bath (0°C) or dry-block calibrator (for fixed points).
- Digital multimeter (for resistance temperature detectors, RTDs).
- Calibration certificate (documenting last calibration date and uncertainty).
- Distilled water (to prevent mineral interference).
- Thermometer under test (e.g., mercury-in-glass, electronic, or bimetallic).
Step-by-Step Calibration Process:
1. Preparation and Safety Checks
- Ensure the thermometer is clean and free of physical damage. For mercury devices, verify the bulb is intact and the scale is legible.
- Note: Electronic thermometers require battery checks and software updates if applicable.
2. Ice-Point Calibration (0°C Reference)
- Fill a Dewar flask or insulated container with crushed ice and distilled water. Stir gently to stabilize at 0°C.
- Submerge the thermometer’s sensing element (bulb or probe) for 5–10 minutes, ensuring no air bubbles adhere.
- Record the reading. Acceptable deviation: ±0.1°C for laboratory-grade instruments; ±0.5°C for general use.
3. Boiling-Point Calibration (100°C Reference, if applicable)
- Use a precision boiling flask with distilled water at standard atmospheric pressure (101.325 kPa).
- Submerge the thermometer and record the reading after stabilization. Adjust for altitude using the formula:
T_adjusted = T_measured + (0.00012 × (P_atm – 101.325)) × 100
Where:
- T_adjusted = Corrected boiling point (°C).
- P_atm = Local atmospheric pressure (kPa).
- Example: At 1,500m elevation (P_atm ≈ 84.5 kPa), the boiling point is ~93.5°C. Adjust readings accordingly.
4. Fixed-Point Verification (Optional for High-Precision Instruments)
- Use a triple-point cell (for 0.01°C accuracy) or gallium melting point cell (29.7646°C) to verify linearity.
- Compare readings to the reference thermometer at three points: 0°C, 20°C, and 100°C.
5. Mid-Range and Span Testing
- Place the thermometer in a dry-block calibrator or controlled environment chamber set to 20°C, 25°C, and 30°C.
- Record deviations at each point. Maximum permissible error (MPE): ±0.2°C for medical-grade devices; ±1°C for residential use.
6. Documentation and Certification
- Log the calibration date, reference instrument model, and observed deviations.
- Affix a calibration sticker with the next due date (typically annually for critical applications).
- Template for Records:
| Point (°C) | Reference Reading | Test Reading | Deviation (°C) | Status |
|---|
| 0 | 0.00 | 0.05 | +0.05 | Within tolerance |
| 20 | 20.00 | 19.8 | -0.2 | Recalibrate |
7. Post-Calibration Validation
- Re-test the thermometer in a known stable environment (e.g., a calibrated incubator or HVAC test chamber) to confirm accuracy.
- For non-laboratory settings, cross-validate with a secondary device (e.g., a smartphone app with calibrated sensors).
Symptoms of Suboptimal Room Temperature and Corrective Actions
Human discomfort from temperature deviations manifests through physiological and behavioral cues. Below is a categorized list of indicators, paired with evidence-based interventions to restore comfort, derived from ASHRAE 55 and ergonomic studies.Thermal Stress Indicators and Solutions:
| Symptom/Indicator | Likely Cause | Corrective Action | Target Range |
|---|
| Dry skin, chapped lips, or static electricity | Low humidity (<30%) | - Increase humidity via humidifier to 40–60%.
- Use a whole-house humidifier for large spaces; portable units for localized areas.
- Monitor with a hygrometer to avoid mold risk (>60%).
| 40–60% RH |
Excessive swe
Technological and Industrial Precision in Room Temperature Control
Modern industrial and scientific environments demand room temperature regulation with tolerances narrower than ±1°C, where deviations can compromise equipment integrity, experimental validity, or product quality. Advanced Heating, Ventilation, and Air Conditioning (HVAC) systems integrate precision engineering—such as setpoint programming, Proportional-Integral-Derivative (PID) controllers, and machine learning-driven adaptive algorithms—to achieve dynamic stability. These systems are calibrated to respond to environmental fluctuations, thermal loads, and occupancy patterns, ensuring compliance with industry-specific standards (e.g., ISO 14644 for cleanrooms, GMP for pharmaceuticals). The interplay between hardware (sensors, actuators) and software (control logic) defines the operational limits of these systems, where even sub-degree variations can trigger cascading failures in temperature-sensitive applications.
Precision Engineering in HVAC Systems
Modern HVAC systems employ a layered approach to temperature regulation, combining hardware precision with algorithmic adaptability to maintain setpoints within specified tolerances. The core components—sensors, controllers, and actuators—operate in closed-loop feedback systems, where real-time adjustments minimize deviations. Setpoint programming allows for time-based or event-triggered temperature adjustments (e.g., lowering setpoints during off-hours to reduce energy consumption while maintaining ±0.5°C stability). PID controllers dynamically adjust heating/cooling outputs by analyzing the error between the measured temperature and the setpoint, with tunable parameters (proportional gain, integral time, derivative rate) optimizing response times and overshoot suppression. Advanced systems incorporate adaptive algorithms, such as fuzzy logic or neural networks, to predict and mitigate thermal drift caused by external factors (e.g., solar radiation, equipment heat generation).Key precision engineering tolerances in industrial HVAC systems include:
- Cleanrooms (ISO Class 5-8): ±0.5°C to ±1°C, with humidity controlled to ±5% RH.
- Data centers: ±1°C to ±2°C, with hot/cold aisle containment reducing local variations to <0.5°C.
- Pharmaceutical storage (cold chain): ±2°C for 2°C–8°C ranges, with alarm triggers at ±1°C deviations.
- Semiconductor fabrication: ±0.1°C in critical zones, achieved via liquid cooling and active thermal shielding.
The integration of variable refrigerant flow (VRF) systems and chilled water loops further enhances precision by enabling zonal control, where individual spaces are regulated independently. For example, a server farm may operate at 22°C (±1°C) while adjacent offices maintain 24°C (±2°C), with sensors placed at critical heights (e.g., rack level for servers) to account for thermal stratification.
Testing Equipment Specifications for Room Temperature Measurement
Accurate temperature measurement is foundational to maintaining precision in controlled environments. The selection of sensors depends on the required accuracy, response time, and calibration stability, with each technology suited to specific applications. Below is a comparative table of common temperature measurement devices, including their technical specifications and typical calibration intervals:
| Sensor Type |
Accuracy (at 20°C) |
Response Time (90% of final value) |
Operating Range |
Calibration Interval |
Key Applications |
|---|
| Type K Thermocouple |
±1.1°C or ±0.75% of reading |
0.1–1.0 seconds (depending on probe size) |
-200°C to +1300°C |
12–24 months (or per manufacturer guidelines) |
Industrial HVAC, process monitoring, high-temperature environments |
| Platinum Resistance Thermometer (PRT, RTD PT100) |
±0.1°C (Class A) or ±0.3°C (Class B) |
0.5–5 seconds (depending on probe design) |
-200°C to +650°C |
6–12 months (or per ISO 9001 requirements) |
Laboratories, pharmaceutical storage, calibration standards |
| Digital Thermometer (Electronic Probe) |
±0.1°C to ±0.5°C (depends on model) |
0.1–2 seconds |
-50°C to +150°C (varies by model) |
12–24 months (or per ISO 17025) |
HVAC commissioning, environmental chambers, field measurements |
| Infrared (IR) Non-Contact Thermometer |
±1°C or ±1% of reading (emissivity-dependent) |
<0.5 seconds (instantaneous) |
-50°C to +3000°C (model-dependent) |
6–12 months (or per manufacturer validation) |
Surface temperature monitoring, equipment diagnostics, non-invasive checks |
| Thermistors (NTC/PTC) |
±0.2°C to ±1°C (high-precision models) |
0.1–0.5 seconds |
-55°C to +150°C (varies by type) |
12–18 months (or per application criticality) |
Consumer electronics, medical devices, rapid-response systems |
Calibration and Traceability:
Sensors must be traceable to national or international standards (e.g., NIST, UKAS) to ensure measurement integrity. RTDs and high-precision thermocouples are often calibrated using fixed-point cells (e.g., triple-point of water at 0.01°C) or comparison with reference standards. Digital probes typically include self-diagnostic features (e.g., sensor drift detection) and data logging for compliance audits. In critical applications, redundant sensors are deployed to cross-validate readings and trigger alerts if discrepancies exceed predefined thresholds (e.g., ±0.2°C).
Impact of Temperature Deviations on Sensitive Equipment
Temperature deviations within ±5°C may appear marginal in general environments, but in precision applications, they can lead to equipment failure, data corruption, or regulatory non-compliance. The following case studies illustrate the cascading effects of even minor thermal excursions:
Case Study: Server Overheating in a Data Center
A high-performance computing cluster operating at a nominal setpoint of 22°C (±1°C) experienced a ±4°C deviation due to a failed HVAC chiller coil. Within 48 hours, the following failures occurred:
- Hardware degradation: CPU throttling activated at 28°C, reducing processing power by 30% and increasing latency.
- Storage corruption: Magnetic disk drives in RAID arrays exhibited bit rot due to elevated temperatures exceeding manufacturer tolerances (typically 10°C–65°C, with optimal performance at 20°C–25°C).
- Power supply failure: Capacitors in server power units degraded prematurely, leading to sudden shutdowns and data loss.
- Cooling system overload: The backup cooling units operated at maximum capacity, resulting in humidity condensation on electronic components and short-circuit risks.
Corrective action: Post-incident analysis revealed that the HVAC system lacked predictive maintenance algorithms to detect chiller inefficiencies. Implementing ±0.5°C alarms and adaptive cooling load balancing reduced future risks by 90%.
Case Study: Pharmaceutical Freezer Drift
A GMP-certified freezer storing vaccines at -20°C (±2°C) experienced a ±3°C deviation due to door cycling and inadequate insulation. The consequences included:
- Protein denaturation: Vaccine efficacy dropped by 15–20% as antibodies degraded outside the specified 2°C–8°C (for thawed products) or -60°C to -10°C (for frozen) ranges.
- Regulatory violation: The deviation triggered a FDA 483 observation, citing failure to maintain "continuous temperature monitoring and documentation."
- Batch
Visual and Descriptive Representations of Room Temperature
Room temperature serves as an intuitive benchmark for human comfort and material behavior, yet its sensory manifestations vary subtly across environments. Describing it requires an interplay of tactile, visual, and thermodynamic cues—where the air feels neither oppressive nor chilled, surfaces neither condense nor dry excessively, and biological systems (such as human skin or food preservation) operate within predictable thresholds. This section explores the sensory landscape of room temperature through vivid descriptions, practical object interactions, and analogies that bridge scientific precision with everyday experience.
Sensory Characteristics of a Room-Temperature Environment
A room maintained at 20–25°C (68–77°F) presents a sensory equilibrium where thermal gradients are minimal, and human physiology responds with neutrality. The air carries a faint, even warmth—enough to prevent goosebumps on exposed skin yet insufficient to induce perspiration. A light cotton sweater draped over a chair feels neither constricting nor drafty; bare arms experience no immediate discomfort, though prolonged exposure might prompt a slight shift in perceived warmth. Condensation does not form on cold surfaces (e.g., a chilled drink glass left for 10 minutes), nor do surfaces feel clammy to the touch. Humidity hovers at 40–60% relative humidity, preventing static cling in fabrics or a stuffy atmosphere. In such conditions, the body’s thermoregulatory systems operate efficiently: breath does not fog visibly, and sweat evaporates steadily without stickiness. The environment feels "alive" yet stable—a balance where molecular motion aligns with human metabolic needs, neither sluggish (as in cold) nor chaotic (as in heat).
Behavior of Common Household Objects at Room Temperature
The interaction between room temperature and everyday materials reveals predictable patterns, serving as a practical litmus test for environmental conditions. Below are observable behaviors of household items under standard room-temperature conditions (20–25°C, 40–60% RH), categorized by physical state and material properties.
- 🧊 Food Preservation:
- Butter softens at the edges within 20–30 minutes when removed from refrigeration (15°C/59°F) but does not melt completely.
- Chocolate (dark or milk) develops a slight bloom (white powdery coating) over weeks due to fat migration, but does not sweat or deform.
- Freshly baked bread retains a slightly moist crumb for 1–2 days before drying out, while its crust remains crisp.
- 🍷 Glassware and Liquids:
- Wine glasses develop minimal condensation (a few droplets) only if the wine is served 5–10°C cooler than room temp (e.g., white wine at 10°C/50°F).
- Cold beer (4°C/39°F) in a glass sweats lightly within 5 minutes but does not form a thick film.
- Olive oil in a decanter remains liquid and pourable without thickening, whereas coconut oil (solid at 24°C/75°F) may soften at the upper end of the range.
- 🧴 Cosmetics and Personal Care:
- Lotion or hand cream does not harden but remains spreadable; thick balms (e.g., petroleum jelly) stay semi-solid.
- Lip balm with beeswax retains its shape but softens enough to apply without resistance.
- Perfume oils evaporate slowly from the skin, leaving a gradual scent trail rather than an immediate burst.
- 📜 Paper and Textiles:
- Newspaper or cardboard does not warp from humidity fluctuations but may feel slightly stiff if stored in low humidity.
- Silk or wool fabrics retain their drape without shrinking or becoming brittle, though static may occur in very dry conditions.
- Cotton towels absorb water without feeling damp to the touch when hung to dry in room air.
- 🔋 Electronics and Batteries:
- Lithium-ion batteries (e.g., in smartphones) operate at optimal efficiency with minimal heat generation; prolonged exposure to >25°C may reduce lifespan.
- LED bulbs emit no perceptible warmth to the touch, whereas incandescent bulbs may feel slightly warm (40–50°C/104–122°F) after 30 minutes.
- Hard drives and SSDs do not overheat during normal use, with internal temps staying below 40°C (104°F).
Room temperature can be conceptualized as the "Goldilocks zone for molecular activity"—a narrow band where kinetic energy in matter neither stagnates nor spirals into chaos. This analogy extends beyond thermodynamics into broader principles of equilibrium, where:> "Just as a campfire requires the right amount of oxygen to burn steadily—neither smothered by excess fuel nor starved by drafts—room temperature balances thermal energy to sustain life, preserve matter, and enable human productivity without stress." Consider the behavior of water vapor in this context: at room temperature, water molecules in the air exist in a dynamic equilibrium—evaporating from surfaces (e.g., a damp cloth) at the same rate they condense. This equilibrium mirrors the human respiratory system, where breath neither condenses visibly (as in cold air) nor feels oppressive (as in humidity-saturated heat). Similarly, food preservation relies on this zone: bacteria grow slowly at room temperature, but not exponentially, allowing perishables like cheese or cured meats to age gracefully over days rather than hours. Even human touch becomes a metaphor—room temperature is the "just-right" warmth of a handshake, neither clammy nor icy, fostering connection without discomfort. The precision of this zone is further illustrated by industrial standards: pharmaceuticals are stored at "controlled room temperature" (typically 20–25°C) to ensure drug stability, while museum conservators maintain similar conditions to prevent wood warping or metal corrosion. In each case, room temperature is not merely a number but a delicate calibration—a sweet spot where entropy and order coexist.
Experimental and Educational Demonstrations in Room Temperature Measurement and Teaching
Room temperature serves as a foundational concept in physics, environmental science, and engineering, yet its practical measurement and educational demonstration often rely on accessible yet precise methods. Experimental approaches—ranging from simple household setups to programmable microcontroller-based systems—provide tangible insights into thermal dynamics, while structured lesson plans bridge theoretical knowledge with hands-on learning. These demonstrations not only clarify the interplay between ambient conditions and perceived comfort but also foster critical thinking about data accuracy, sensor calibration, and real-world applications in climate control.
Simple Experiment to Measure Room Temperature Using Everyday Materials
A basic yet effective experiment for measuring room temperature involves leveraging the thermal equilibrium principle using water, ice, and an alcohol thermometer. This method approximates the triple point of water (0.01°C at 1 standard atmosphere), a reference point for temperature calibration, while demonstrating how environmental factors influence readings. The experiment requires minimal equipment, emphasizes safety, and yields predictable results aligned with standard room temperature ranges (typically 20–25°C). Materials and Setup:
- A sealed glass container (e.g., a large jar or beaker)
- Distilled water (to minimize impurities affecting freezing)
- Crushed ice (preferably at 0°C)
- An alcohol thermometer (range: –10°C to 50°C, with 0.1°C precision)
- A digital stopwatch (for timing observations)
- A fan or ventilated space (for comparative testing)
- Safety goggles and gloves (to prevent frostbite or thermometer breakage)
Procedure:
1. Preparation of the Reference Point:
Fill the container halfway with distilled water and add crushed ice until the water level stabilizes. Stir gently to ensure uniform temperature distribution. The mixture should reach 0°C (the melting/freezing point of ice at standard pressure), serving as a calibration baseline.
Note: Alcohol thermometers are preferred over mercury-based ones due to safety and lower toxicity. Ensure the thermometer bulb is fully submerged in the ice-water slurry for accurate readings.
2. Room Temperature Measurement:
Remove the thermometer from the ice bath and place it in the target room environment. Record the temperature at 1-minute intervals for 5 minutes to observe stabilization. Compare readings taken in:
- A sealed room (minimal airflow).
- A ventilated room (e.g., near an open window or fan).
Expected results should show:
- Stable readings within ±1°C of the room’s actual temperature (verified against a calibrated digital thermometer).
- Slower stabilization in sealed environments due to reduced convection.
- Faster equilibrium in ventilated spaces, where air movement accelerates heat transfer.
Safety Considerations:
- Thermometer Handling: Alcohol can be flammable; avoid open flames during the experiment. If the thermometer breaks, ventilate the area immediately.
- Ice Exposure: Wear gloves to prevent frostbite when handling ice or cold equipment.
- Spill Prevention: Use a tray beneath the container to contain water spills.
Expected Outcomes and Analysis:
- The experiment validates the triple point of water as a reference and highlights how air circulation affects temperature measurement accuracy.
- Discrepancies between sealed and ventilated readings illustrate the heat capacity of air and the role of convection in thermal equilibrium.
- For advanced analysis, students can plot data to compare time constants of temperature stabilization in different environments.
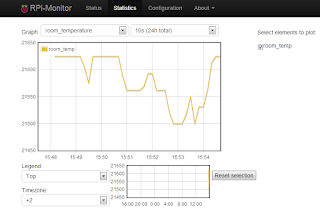
DIY Room Temperature Monitor Using Raspberry Pi or Arduino
Microcontroller-based systems enable real-time, programmable temperature monitoring with customizable logging and alerts. A Raspberry Pi (RPi) or Arduino setup integrates sensors, data acquisition, and visualization tools, making it ideal for educational or industrial applications. Below are component lists, code snippets, and data logging methods for two configurations: a low-cost Arduino solution and a RPi-based system with cloud logging.Component Requirements and Justification: | Component | Arduino Setup | Raspberry Pi Setup | Purpose |
|---|
| Microcontroller | Arduino Uno/NANO (ATmega328P) | Raspberry Pi 3/4 (RPi OS Lite) | Central processing unit for sensor data acquisition. |
| Temperature Sensor | DHT22 (AM2302) or DS18B20 | DS18B20 (waterproof) or BME280 | Measures temperature (±0.5°C accuracy) with optional humidity/pressure data. |
| Power Supply | 9V battery or USB adapter | 5V USB power supply or PoE | Ensures stable operation; RPi may require a dedicated power source. |
| Breadboard & Jumper Wires | 400-point breadboard, male-female wires | Breadboard or direct soldering | Prototyping connections between components. |
| Data Storage/Logging | MicroSD card (for Arduino) | RPi’s built-in storage or cloud (MQTT) | Stores historical data for trend analysis. |
| Display (Optional) | 16x2 LCD (I2C) or OLED | HDMI monitor or serial console | Visual feedback for real-time monitoring. |
| Enclosure | 3D-printed case or project box | Plastic case with ventilation holes | Protects components from dust and physical damage. |
Arduino Implementation:
1. Circuit Assembly:
Connect the DS18B20 sensor to the Arduino’s digital pin 2 (using a 4.7kΩ resistor for pull-up). For the DHT22, connect data pin to D3, VCC to 5V, and GND to GND.
Caution: Avoid powering the DHT22 with >3.3V if using an Arduino Mega (3.3V logic pins).
2. Code Snippet (DS18B20 Example):#include
#include #define ONE_WIRE_BUS 2
OneWire oneWire(ONE_WIRE_BUS);
DallasTemperature sensors(&oneWire); void setup() {
Serial.begin(9600);
sensors.begin();
} void loop() {
sensors.requestTemperatures();
float tempC = sensors.getTempCByIndex(0);
Serial.print("Temperature: ");
Serial.print(tempC);
Serial.println(" °C");
delay(2000); // Log every 2 seconds
} 3. Data Logging:
- Use the Arduino IDE’s Serial Monitor for real-time display.
- For permanent logging, interface with an SD card module (e.g., Adafruit SD library) or upload data to a Google Sheet via Wi-Fi (ESP8266/ESP32 add-on).
Raspberry Pi Implementation:
1. Sensor Interface:
Connect the DS18B20 to GPIO4 (with 4.7kΩ pull-up resistor). Enable 1-Wire support in `/boot/config.txt`: dtoverlay=w1-gpio,gpiopin=4 Verify sensor detection via: sudo modprobe w1-gpio
sudo modprobe w1-therm
ls /sys/bus/w1/devices/ 2. Python Script for Logging: import glob
import time
import csv
from datetime import datetime base_dir = '/sys/bus/w1/devices/'
device_folder = glob.glob(base_dir + '28*')[0]
device_file = device_folder + '/w1_slave' log_file = 'temp_log.csv'
with open(log_file, 'a') as f:
writer = csv.writer(f)
writer.writerow(['Timestamp', 'Temperature (°C)']) while True:
with open(device_file, 'r') as f:
lines = f.readlines()
temp_raw = lines[1].strip().split('=')[1].split(' ')[0]
temp_c = float(temp_raw) / 1000.0
timestamp = datetime.now().strftime('%Y-%m-%d %H:%M:%S')
with open(log_file, 'a') as f:
writer = csv.writer(f)
writer.writerow([timestamp, temp_c])
time.sleep(60) # Log every minute 3. Cloud Integration (Optional):
Use MQTT (e.g., Mosquitto broker) to transmit data to platforms like ThingSpeak or InfluxDB for remote monitoring. Example MQTT payload: import paho.mqtt.client as mqtt
client = mqtt.Client()
client.connect("broker.hivemq Room temperature emerges as a pivotal yet often overlooked variable, shaping everything from molecular stability in laboratories to the comfort of daily life. Whether measured through calibrated thermocouples in industrial settings or perceived through the tactile neutrality of a sweater in a temperate climate, its definition is a synthesis of science, culture, and engineering. The interplay of humidity, altitude, and technological advancements further refines this baseline, demanding adaptive approaches—from PID-controlled HVAC systems to culturally tailored residential norms. Ultimately, mastering room temperature involves balancing precision with practicality, ensuring environments remain optimal for both human well-being and technological reliability.
FAQ
What temperature is considered room temperature for water?
Room temperature for water is typically between 68°F and 72°F (20°C and 22°C). This range is comfortable for drinking and food preparation, as it aligns with standard indoor temperatures.
What temperature is room temperature for butter?
Butter is usually considered at room temperature when it reaches 65°F to 68°F (18°C to 20°C). Below this, it stays solid; above, it softens but doesn’t fully melt.
What temperature is room temperature for milk?
Milk is at room temperature around 60°F to 68°F (15°C to 20°C). It should never exceed 70°F (21°C) for safety, as bacteria multiply faster in warmer milk.
What is the exact temperature range for room temperature?
Room temperature is generally defined as 68°F to 72°F (20°C to 22°C). This range is based on standard indoor climate control settings for comfort and food safety.
What temperature is room temperature for eggs?
Eggs are at room temperature when they reach 68°F to 72°F (20°C to 22°C). This allows them to be used directly in recipes (e.g., baking) without being cold or overly warm.
What temperature is room temperature for steak?
Steak is considered at room temperature when it reaches 65°F to 70°F (18°C to 21°C). This ensures even cooking and prevents overcooking the exterior before the center warms through.
|
|
Leave a Comment
Comments are moderated before appearing. The data you submit is processed according to the Privacy Policy of Voltefac.