What Can Be Recycled Essentials For Sustainable Living
Table of Contents
- Common Recyclable Materials and Their Categories
- Classification of Recyclable Materials by Category
- Structured Examples of Recyclable Items by Category
- Regional and Local Recycling Guidelines
- Variations in Recycling Rules by Region
- Common Misconceptions About Recycling
- Household Preparation Flowchart for Recycling Materials
- Innovations and Emerging Technologies in Recycling
- Chemical Recycling: Molecular Deconstruction of Plastics
- Comparison of Recycling Technologies: Mechanical vs. Emerging Methods
- Urban Mining: Extracting Metals from Electronic Waste
- AI-Driven Sorting Systems in Recycling Facilities
- Challenges and Barriers to Recycling
- Systemic Barriers to Recycling Efficiency
- Wishcycling and Its Impact on Waste Facilities
- Environmental Trade-Offs: Recycling vs. Composting vs. Landfilling Organic Waste
- Greenwashing in Recycling Campaigns
- Creative and Practical Recycling Solutions
- DIY Repurposing Projects for Non-Recyclable Items
- Underrated Recyclable Materials and Donation Programs
- Upcycled Products: Material Sources, Creators, and Environmental Impact
- FAQ
- What items can be recycled in Hong Kong?
- What can I recycle at Boots stores in the UK?
- What can be placed in the blue recycling bin?
- What items are recyclable in Singapore?
- What everyday items can I recycle at home?
- What can be recycled in the UK?
Understanding what can be recycled is the foundation of effective waste reduction, yet misconceptions and regional variations often complicate the process. From plastics and metals to electronics and organic materials, modern recycling systems rely on precise categorization, technological innovation, and community participation to transform waste into valuable resources. This guide explores the science, challenges, and practical solutions behind recycling, equipping individuals and organizations with actionable insights to minimize landfill contributions and maximize material recovery.
The global shift toward circular economies demands a nuanced approach to waste management, where every material—whether a soda bottle, an old smartphone, or a coffee cup—holds potential for reuse. By examining recycling protocols, emerging technologies, and real-world barriers, this discussion provides a comprehensive framework for making informed decisions. Whether navigating curbside rules or exploring DIY upcycling, the principles outlined here bridge the gap between intention and impact, fostering a culture of sustainability that extends beyond the bin.
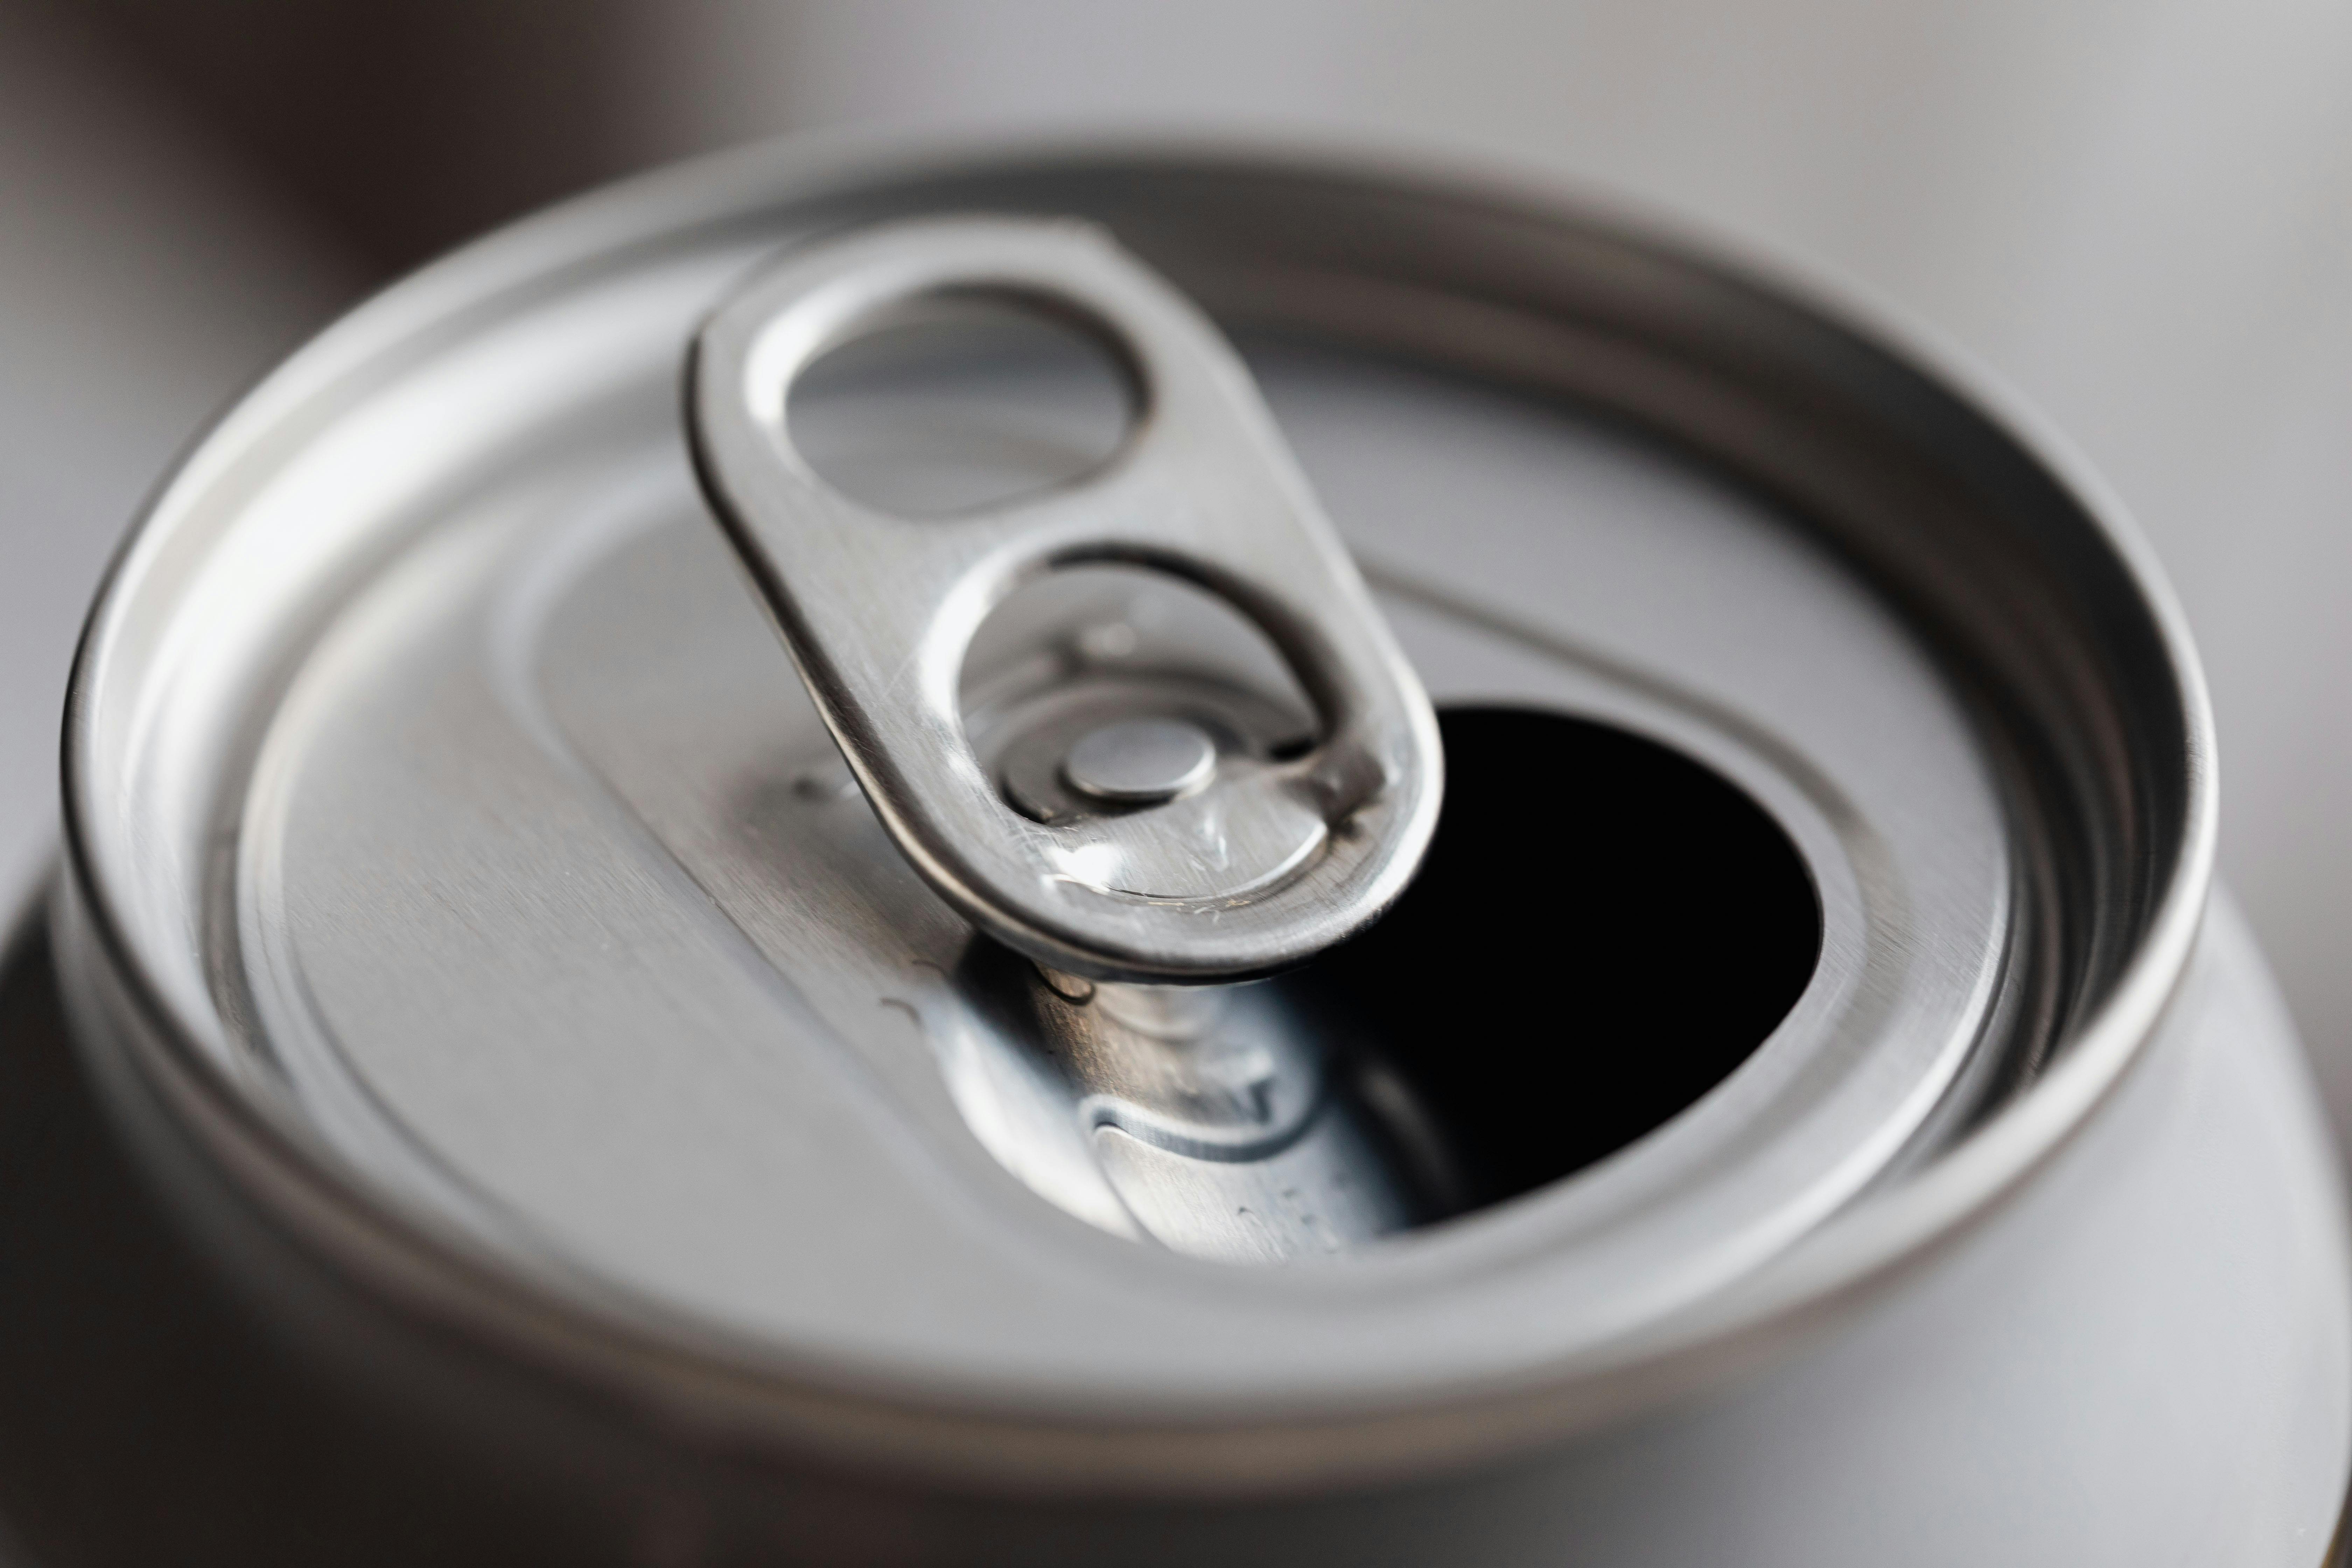
Common Recyclable Materials and Their Categories
Recycling systems worldwide rely on standardized categorization of materials to streamline collection, processing, and reprocessing. Proper classification ensures efficiency in waste management, reduces contamination in recycling streams, and maximizes resource recovery. Materials are broadly grouped into five primary categories—paper, plastic, metal, glass, and electronics—each with distinct properties, recycling protocols, and environmental impacts. Understanding these categories, their sub-types, and visual/tactile identifiers is critical for consumers, waste handlers, and recycling facilities to optimize sorting accuracy and sustainability outcomes.The following sections outline the classification framework, provide structured examples of recyclable items, and detail methods for distinguishing materials, particularly plastics, which vary significantly in composition and recyclability.
Classification of Recyclable Materials by Category
Recyclable materials are organized into five core categories based on chemical composition, physical properties, and reprocessing feasibility. Each category adheres to industry-specific recycling codes (e.g., the Resin Identification Code for plastics) and may include sub-categories that influence acceptance in curbside programs. Below is a breakdown of the categories, their defining characteristics, and examples of items commonly encountered in household and commercial waste streams.Key Considerations for Categorization:
Structured Examples of Recyclable Items by Category
The following table lists 10 common items per category, their associated recycling codes (where applicable), and curbside acceptance status based on global trends. Note that acceptance varies by locality; verification with local waste management guidelines is advised.| Category | Item | Recycling Code (if applicable) | Widely Accepted in Curbside Programs? | |||||||||||||||||||||||||||||||||||||||||||||||||||||||
|---|---|---|---|---|---|---|---|---|---|---|---|---|---|---|---|---|---|---|---|---|---|---|---|---|---|---|---|---|---|---|---|---|---|---|---|---|---|---|---|---|---|---|---|---|---|---|---|---|---|---|---|---|---|---|---|---|---|---|
| Paper | ||||||||||||||||||||||||||||||||||||||||||||||||||||||||||
| Newspapers | N/A | Yes (unless contaminated) | ||||||||||||||||||||||||||||||||||||||||||||||||||||||||
| Office paper (printer/copier) | N/A | Yes | ||||||||||||||||||||||||||||||||||||||||||||||||||||||||
| Corrugated cardboard boxes | N/A | Yes (flattened) | ||||||||||||||||||||||||||||||||||||||||||||||||||||||||
| Egg cartons (paper-based) | N/A | Yes (check local rules) | ||||||||||||||||||||||||||||||||||||||||||||||||||||||||
| Telephone books | N/A | Yes | ||||||||||||||||||||||||||||||||||||||||||||||||||||||||
| Paperboard (cereal boxes) | N/A | Yes (remove plastic liners) | ||||||||||||||||||||||||||||||||||||||||||||||||||||||||
| Magazines and catalogs | N/A | Yes | ||||||||||||||||||||||||||||||||||||||||||||||||||||||||
| Paper grocery bags | N/A | Yes (if not wax-coated) | ||||||||||||||||||||||||||||||||||||||||||||||||||||||||
| Manila envelopes (without plastic windows) | N/A | Yes | ||||||||||||||||||||||||||||||||||||||||||||||||||||||||
| Paper towels and napkins (soiled) | N/A | No (contamination risk) | ||||||||||||||||||||||||||||||||||||||||||||||||||||||||
| Plastic | ||||||||||||||||||||||||||||||||||||||||||||||||||||||||||
| Soda bottles (PET #1) | PET (Polyethylene Terephthalate) | Yes | ||||||||||||||||||||||||||||||||||||||||||||||||||||||||
| Milk jugs (HDPE #2) | HDPE (High-Density Polyethylene) | Yes | ||||||||||||||||||||||||||||||||||||||||||||||||||||||||
| Shampoo bottles (PP #5) | PP (Polypropylene) | Limited (check local) | ||||||||||||||||||||||||||||||||||||||||||||||||||||||||
| Yogurt cups (PS #6) | PS (Polystyrene) | No (often not accepted) | ||||||||||||||||||||||||||||||||||||||||||||||||||||||||
| Plastic bags (LDPE #4) | LDPE (Low-Density Polyethylene) | No (requires drop-off) | ||||||||||||||||||||||||||||||||||||||||||||||||||||||||
| Water bottles (PET #1) | PET | Yes | ||||||||||||||||||||||||||||||||||||||||||||||||||||||||
| Detergent bottles (HDPE #2) | HDPE | Yes | ||||||||||||||||||||||||||||||||||||||||||||||||||||||||
| Takeout containers (PP #5) | PP | Limited | ||||||||||||||||||||||||||||||||||||||||||||||||||||||||
| Egg cartons (plastic) | PS or PP | No | ||||||||||||||||||||||||||||||||||||||||||||||||||||||||
| Styrofoam (EPS #6) | EPS (Expanded Polystyrene) | No | ||||||||||||||||||||||||||||||||||||||||||||||||||||||||
| Metal | ||||||||||||||||||||||||||||||||||||||||||||||||||||||||||
| Aluminum cans (beverage) | Aluminum (Al) | Yes | ||||||||||||||||||||||||||||||||||||||||||||||||||||||||
| Steel cans (food) | Steel (Fe) | Yes | ||||||||||||||||||||||||||||||||||||||||||||||||||||||||
| Aluminum foil (unsoiled) | Aluminum (Al) | Limited (check local) | ||||||||||||||||||||||||||||||||||||||||||||||||||||||||
| Bike frames | Aluminum/Steel | Yes (e-waste or metal recycling) | ||||||||||||||||||||||||||||||||||||||||||||||||||||||||
| Cookware (stainless steel) | Stainless Steel (Fe/Cr/Ni) | Yes (metal recycling) | ||||||||||||||||||||||||||||||||||||||||||||||||||||||||
| Scrap metal (nails, bolts) | Ferrous/Non-ferrous | Yes (scrap programs) | ||||||||||||||||||||||||||||||||||||||||||||||||||||||||
| Aluminum window frames | Aluminum (Al) | Yes (scrap) | ||||||||||||||||||||||||||||||||||||||||||||||||||||||||
| Copper wires | Copper (Cu) | Yes (e-waste or scrap) | ||||||||||||||||||||||||||||||||||||||||||||||||||||||||
| Aluminum ladders | Aluminum (Al) | Yes (scrap) | ||||||||||||||||||||||||||||||||||||||||||||||||||||||||
| Tin cans (coated steel) | Tinplate (Fe/Sn) | Yes | ||||||||||||||||||||||||||||||||||||||||||||||||||||||||
| Glass | ||||||||||||||||||||||||||||||||||||||||||||||||||||||||||
| Beer/wine bottles (clear) | Soda-lime glass | Yes | ||||||||||||||||||||||||||||||||||||||||||||||||||||||||
| Green glass jars | Soda-lime glass (with chromium) | Yes | ||||||||||||||||||||||||||||||||||||||||||||||||||||||||
| Brown glass bottles | Soda-lime glass (with iron) | Yes | ||||||||||||||||||||||||||||||||||||||||||||||||||||||||
| Glass food containers | Soda-lime glass | Yes | ||||||||||||||||||||||||||||||||||||||||||||||||||||||||
| Mirrors | Soda-lime glass (with reflective coating) | No (often not accepted) | ||||||||||||||||||||||||||||||||||||||||||||||||||||||||
| Glass ovenware | Borosilicate glass | No (specialized recycling) | ||||||||||||||||||||||||||||||||||||||||||||||||||||||||
| Glass light bulbs (CFLs) | Soda-lime/borosilicate (with mercury) | No (hazardous waste) | ||||||||||||||||||||||||||||||||||||||||||||||||||||||||
| Glass laboratory equipment | Borosilicate | No (specialized) | ||||||||||||||||||||||||||||||||||||||||||||||||||||||||
Glass ceramics (e.g., Pyrex)
Regional and Local Recycling GuidelinesRecycling programs vary significantly across urban, suburban, and rural areas due to differences in infrastructure, population density, and municipal policies. These variations influence what materials are accepted, how they should be prepared, and the frequency of collection. Understanding local guidelines is critical to maximizing recycling efficiency and avoiding contamination of entire batches. Municipalities often adjust their rules based on processing capabilities, market demand for recyclables, and community feedback, leading to inconsistencies even within neighboring regions.The effectiveness of recycling hinges on adherence to regional protocols, which may include restrictions on soiled containers, mixed materials, or non-recyclable plastics. Below, the distinctions between urban, suburban, and rural recycling systems are outlined, followed by common misconceptions and a standardized preparation process for households. Variations in Recycling Rules by RegionUrban, suburban, and rural areas implement recycling programs tailored to their operational constraints and waste generation patterns. Urban centers, with high population densities, often prioritize single-stream recycling (co-mingled materials) to streamline collection, while rural areas may rely on dual-stream (separated paper/cardboard and containers) due to lower collection frequencies and limited processing infrastructure.Key regional differences:
Municipal guidelines are shaped by: Common Misconceptions About RecyclingPublic confusion about recyclable materials leads to contamination and reduced recovery rates. Below are five prevalent myths debunked with evidence-based corrections, supported by data from the EPA and Recycling Science Fundamentals (2020).
Household Preparation Flowchart for Recycling MaterialsProper preparation of recyclables ensures they meet municipal standards and avoids processing delays. Below is a step-by-step flowchart for household sorting, designed for HTML implementation using `` and `
Flowchart Structure (Descriptive
Innovations and Emerging Technologies in RecyclingAdvancements in recycling technology are transforming waste management from a linear process into a circular economy framework, where materials are continuously reused with minimal degradation. Among the most promising developments are chemical recycling, which decomposes plastics into molecular building blocks, and AI-driven sorting systems, which enhance recovery rates through real-time data analysis. These innovations address long-standing limitations of traditional mechanical recycling—such as contamination, energy intensity, and material downgrading—while unlocking new opportunities for recovering high-value metals from electronic waste (e-waste) through urban mining. Below, the focus is on scalable solutions, comparative efficiency metrics, and industry-led implementations that are reshaping recycling infrastructure globally.Chemical Recycling: Molecular Deconstruction of PlasticsChemical recycling employs thermal, catalytic, or enzymatic processes to break down polymers into monomers, oils, or gases, which can be repolymerized into virgin-like materials. Unlike mechanical recycling, which shreds and melts plastics—leading to degradation over successive cycles—chemical methods restore polymers to their original molecular structure, enabling infinite recyclability for plastics like polyethylene terephthalate (PET) and polypropylene (PP). Key techniques include:Scalability Challenges: Key Advantage: Chemical recycling enables closed-loop recycling for mixed plastic waste streams, including multilayer films and contaminated packaging, which are unrecyclable via mechanical means. Comparison of Recycling Technologies: Mechanical vs. Emerging MethodsThe efficiency of recycling technologies varies across metrics such as energy consumption, material recovery rate, and operational costs. Below is a comparative analysis of traditional mechanical recycling and emerging methods, including enzymatic breakdown and pyrolysis, based on industry reports (e.g., Ellen MacArthur Foundation, 2022; IEA, 2023).
Critical Insight: Emerging technologies excel in high-value material recovery but require policy incentives (e.g., Extended Producer Responsibility) and infrastructure integration to overcome economic barriers. Hybrid systems, combining mechanical and chemical methods, are emerging as the most viable near-term solution. Urban Mining: Extracting Metals from Electronic WasteElectronic waste (e-waste) contains gold, silver, copper, and rare earth elements at concentrations 40–50 times higher than ores, making it a critical source for urban mining. The process involves dismantling, shredding, and hydrometallurgical/refractory refining to recover metals with 90–99% efficiency. Key steps include:1. Preprocessing: Case Study: Urban Mining in the EU Economic Driver: The global e-waste market is projected to reach $71.5 billion by 2028 (Statista), with urban mining reducing reliance on mining virgin ores (which contributes ~8% of global CO₂ emissions). AI-Driven Sorting Systems in Recycling FacilitiesTraditional recycling sorting relies on manual labor and basic sensors, leading to error rates of 10–20% andChallenges and Barriers to RecyclingRecycling systems face persistent systemic challenges that hinder their efficiency, scalability, and environmental effectiveness. These barriers span contamination in waste streams, disparities in infrastructure between developed and developing regions, economic incentives favoring virgin materials, and behavioral misconceptions like wishcycling. Addressing these issues requires a multifaceted approach—balancing technological innovation, policy reform, and consumer education—while acknowledging the trade-offs between recycling, composting, and landfilling for organic waste. Misleading marketing practices further complicate public trust, underscoring the need for transparent, evidence-based recycling guidelines.The global recycling industry operates under structural inefficiencies that limit its potential to reduce landfill waste and lower carbon emissions. Contamination rates—where non-recyclable materials (e.g., greasy pizza boxes, plastic-lined coffee cups) infiltrate sorting facilities—disrupt automated systems and increase operational costs. In 2022, the U.S. alone discarded 29 million tons of recyclables due to contamination, costing municipalities an estimated $1.3 billion annually in lost revenue and processing delays (EPA, 2023). Meanwhile, developing nations often lack the infrastructure to handle recyclables, relying on informal waste pickers or landfills. For example, India’s recycling rate stands at just 30%, with 80% of waste processed by unregulated, often hazardous, informal sectors (CPCB, 2021). Economic dependencies on virgin materials—such as plastic manufacturers subsidized by fossil fuel industries—further suppress demand for recycled alternatives, perpetuating a cycle of overproduction and waste. Systemic Barriers to Recycling EfficiencyContamination in recycling streams remains the most critical operational challenge, directly impacting sorting facility productivity. Automated sorting systems, which rely on optical scanners and air classifiers, misidentify or reject contaminated materials, leading to diversion rates as low as 30% in some U.S. facilities (Resource Recycling, 2022). A 2021 study by the University of Georgia found that food residue on paper products (e.g., cereal boxes) reduces recycling success by 40%, while plastic bags tangled in machinery cause $200,000 in annual repair costs at a single facility in California.Lack of infrastructure in developing regions exacerbates global waste disparities. In Sub-Saharan Africa, only 2% of plastic waste is recycled, with 90% ending in landfills or the environment (UNEP, 2020). Countries like Ghana and Nigeria face challenges from illegal dumping, weak waste management laws, and reliance on single-stream recycling—a system that lacks the separation precision of dual-stream models. Conversely, Germany’s closed-loop recycling system achieves a 65% recycling rate through strict source separation, deposit schemes, and high collection fees for non-compliant waste (BMUV, 2023). Economic barriers also persist: China’s 2018 National Sword policy, which banned imports of foreign plastic waste, forced Western nations to rethink their recycling exports, leading to stockpiles of unprocessed plastic in ports like Rotterdam and Los Angeles. The economic dependence on virgin materials undermines recycling markets. For instance, recycled plastic (rPET) costs 20–30% more to produce than virgin PET, despite its lower carbon footprint (Ellen MacArthur Foundation, 2021). The petrochemical industry’s lobbying has delayed policies like the EU’s Single-Use Plastics Directive, which mandates 30% recycled content in plastic packaging by 2030. In the U.S., only 9% of plastic waste is recycled, partly due to cheaper virgin plastic production subsidized by tax breaks (Greenpeace USA, 2022). Wishcycling and Its Impact on Waste FacilitiesWishcycling—the act of placing non-recyclable items in recycling bins in the hope they will be processed—creates operational nightmares for waste management facilities. While well-intentioned, it introduces foreign contaminants that jam sorting equipment, increase labor costs for manual separation, and divert valuable recyclables to landfills. A 2020 report by the Institute of Scrap Recycling Industries (ISRI) estimated that wishcycling costs U.S. municipalities $400 million annually in lost revenue and additional processing.> "Wishcycling is the single biggest enemy of recycling programs. When people put the wrong things in the bin, it’s like putting sugar in your gas tank—it doesn’t work, and it breaks the system." Facilities often reject entire truckloads of mixed waste if contamination exceeds 5–10%, forcing municipalities to incinerate or landfill the contents. For example, San Francisco’s recycling program saw a 20% drop in accepted materials in 2022 after a surge in wishcycled items like electronic waste, soft plastics, and polystyrene (SF Environment, 2023). Curbside contamination rates in the U.S. average 25%, with paper and cardboard being the most frequently misplaced items (EPA, 2023). To mitigate wishcycling, cities are adopting strict education campaigns and real-time feedback systems. Tokyo’s "BinCam" project uses AI-powered cameras to scan bins and provide instant notifications to residents about incorrect items. Meanwhile, Australia’s "Recycle Right" program includes fines for repeat offenders in some regions, though enforcement remains inconsistent. Environmental Trade-Offs: Recycling vs. Composting vs. Landfilling Organic WasteOrganic waste—comprising food scraps, yard trimmings, and paper products—presents a critical decision point in waste management, with methane emissions, soil health, and energy recovery as key trade-offs. Landfilling organic waste is the least sustainable option, as it generates methane (CH₄), a greenhouse gas 28 times more potent than CO₂ over 100 years (IPCC, 2021). In the U.S., landfills account for 15% of methane emissions, with organic waste being the second-largest contributor after enteric fermentation in livestock (EPA, 2023).Composting offers a low-carbon alternative, reducing methane emissions by diverting waste from landfills and producing a soil amendment that sequesters carbon. Aerobic composting (with oxygen) minimizes methane, while anaerobic digestion (without oxygen) can produce biogas for energy, though it requires controlled conditions. Studies show that composting 1 ton of food waste avoids 0.5 tons of CO₂-equivalent emissions (USDA, 2022). However, poorly managed composting (e.g., open-air piles) can still emit significant methane, and contaminants like meat or dairy can attract pests and reduce compost quality. Recycling organic waste into cellulose-based materials (e.g., biodegradable plastics, packaging) is emerging but faces scalability challenges. Polylactic acid (PLA), derived from corn starch, decomposes in industrial composting but requires high temperatures (60°C+)—unlike home composting. Meanwhile, landfilling organic waste is cheaper for municipalities but costs society dearly in climate impact. For example, New York City’s landfill methane emissions from organic waste were estimated at 1.2 million metric tons of CO₂-equivalent annually (NYC DEP, 2021), equivalent to 250,000 cars’ emissions.
Greenwashing in Recycling CampaignsMisleading marketing tactics—collectively termed greenwashing—erode public trust in recycling by overstating the benefits of certain materials while obscuring environmental trade-offs. Companies exploit vague terms like "biodegradable," "compostable," or "rec
Creative and Practical Recycling SolutionsInnovative recycling extends beyond traditional waste streams, transforming discarded materials into functional, sustainable products while reducing landfill contributions. Practical solutions—ranging from DIY upcycling to community-driven zero-waste initiatives—offer scalable methods to minimize environmental impact. This section explores actionable strategies, including step-by-step repurposing projects, underutilized recyclable materials, and structured frameworks for community engagement.DIY Repurposing Projects for Non-Recyclable ItemsUpcycling non-recyclable waste into reusable items conserves resources and reduces disposal costs. Below are three projects with clear instructions, material requirements, and environmental benefits.1. T-Shirt Tote Bags from Old Clothing 2. Glass Jar Organizers for Kitchen or Office 3. Pallet Wood Furniture with Minimal Tools Underrated Recyclable Materials and Donation ProgramsMany materials overlooked in standard recycling programs have high reuse value. Below are five categories with verified collection programs, including contact details for global and regional initiatives.Note: Always verify local regulations, as some programs require pre-sorting or special packaging.1. Old Eyeglasses Why Recycle: 1.5 billion pairs end up in landfills annually; lenses and frames contain recoverable metals (e.g., titanium, aluminum) and can be reused for vision correction in developing regions. Programs: 2. Ink and Toner Cartridges 3. Cork 4. Mobile Phones and Electronics 5. Shoes and Athletic Wear Upcycled Products: Material Sources, Creators, and Environmental ImpactThe following table highlights innovative upcycled products, their origins, and measurable sustainability benefits. Data is sourced from creator interviews and life-cycle assessments (LCA) where available.
|

.JPG/220px-Can(Easy_Open_Can).JPG)
Leave a Comment
Comments are moderated before appearing. The data you submit is processed according to the Privacy Policy of Voltefac.